3.7.5.3 Supervised Training from Well Data
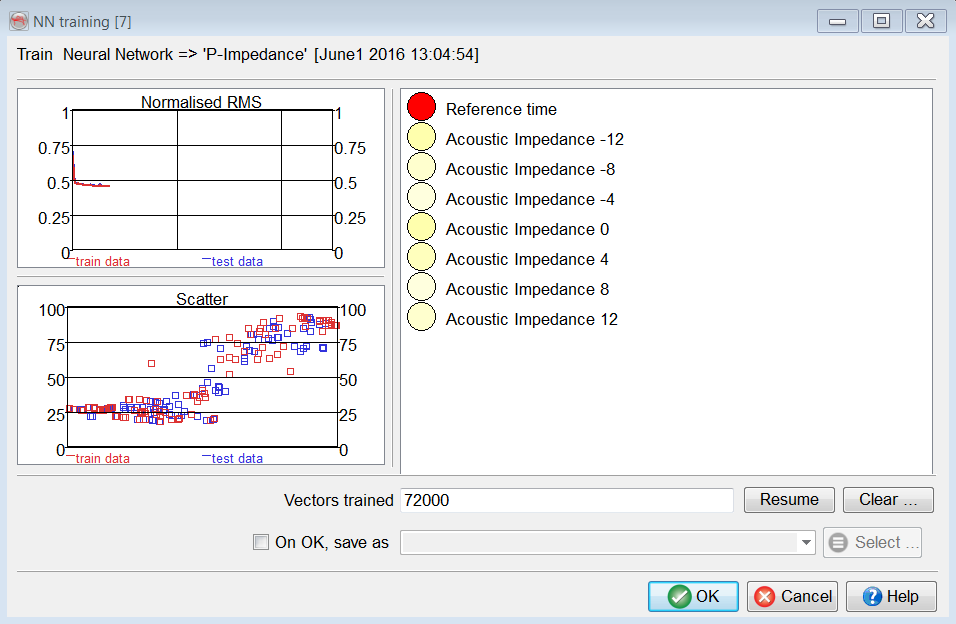
The Supervised training window from well data is very similar to the training window from a Pickset (see below). The only difference is the display of a scatter plot instead of a % Misclassification plot. A scatter plot shows the actual target data on the horizontal axis and the predicted target data by the neural network, as it is at that moment, on the vertical axis. Not all nodes are plotted. Only a random selection of the used train and test data is shown. Ideally, after sufficient training, all data points should be on the diagonal. That would mean that the trained neural network predicted all examples correctly.
However, this will rarely be the case. In most cases, the data will cluster along the diagonal. The narrower this cloud, the better the neural network is trained. Overtraining occurs when the Normalized RMS of the test data increases, while the Normalized RMS of the train set decreases. This usually also means that the cloud of train nodes becomes narrower, while the cloud of test nodes becomes wider again.