1.2 Basemap
OpendTect’s basemap is accessible from OpendTect’s main menu (View > Basemap) or this shortcut icon (![]() ). A separate detached window is launched, which is by default synchronized with the 3D scene. We recommend turning such synchronization off if the data size (e.g. area or number of 2D seismic line) is huge.
). A separate detached window is launched, which is by default synchronized with the 3D scene. We recommend turning such synchronization off if the data size (e.g. area or number of 2D seismic line) is huge.
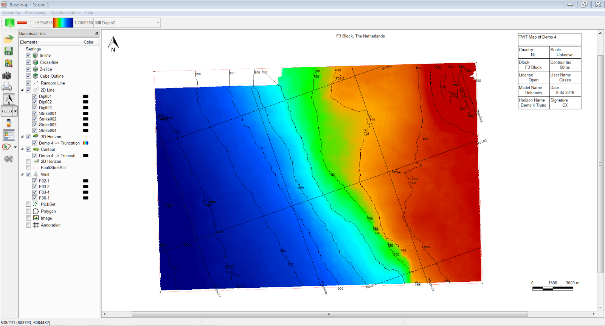
Basemap comes with its own tree allowing an independent control of data displays. An overview of the basemap window is given below:
Main Menus
Basemap
This includes:
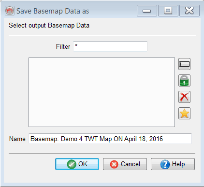
Save (![]() ) or Save As (
) or Save As (![]() ) are used to save the current displays as a map for future use. We highly recommend saving a basemap on a routine bases. Multiple copies of the map are also allowed.
) are used to save the current displays as a map for future use. We highly recommend saving a basemap on a routine bases. Multiple copies of the map are also allowed.
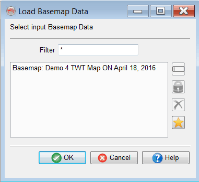
A previously stored basemap can be retrieved using the Open (![]() ) icon. You can set one basemap as a favourite /default item (
) icon. You can set one basemap as a favourite /default item (![]() ). If set, the selected basemap will be opened every time a new OpendTect is started.
). If set, the selected basemap will be opened every time a new OpendTect is started.
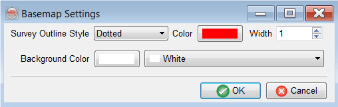
The settings sub-menu is used to change the outline style (line pattern, thickness, and color) of the current basemap. The default background color is white, which can also be changed, if needed be.
Processing
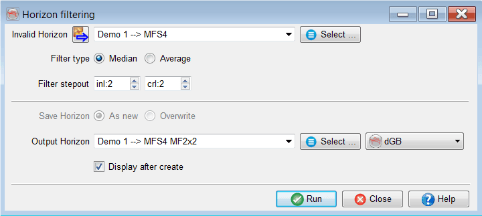
Filtering: A selected horizon grid can be filtered within the basemap. Median filtered is preferred if you intend to de-spike a horizon grid. Average filter is considered as a general smoothing filter. If you intend to display the resultant grid then check the Display after create option.
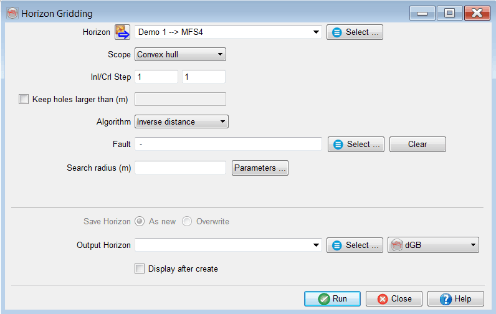
Gridding: OpendTect supports several gridding algorithms (For details refer to 3.7.3.1 Grid in OpendTect User Documentation). The supported parameters are summarized below:
- Scope: This is used to control the exterior geometry of the output horizon. Convex hull is mostly used, which automatically creates polygon (hull) using the exterior data points of a given horizon and creates are horizon within this polygon.
- Inl/Crl Steps: This option defines the output grid spacing. Often the seismic surveys are defined with an average spacing of 12.5m or 25m as a step. For larger surveys, we recommend under-sampling the output grid to 2 by 2 or even 5 by 5.
- Keep holes larger than (m): This option is used to keep larger holes in the survey. The gridding algorithm will not interpolate the areas larger than the set size.
- Algorithm: Several gridding algorithms are supported (For details refer to 3.7.3.1 Grid in OpendTect User Documentation). Some of them use the fault e.g. dip steered gridding algorithm (requires 3D seismic).
- Search radius (m): It is mostly a best practice to include a part of data points within the search radius. For instance, if 2D lines are evenly spaced at 2000m and most of the lines have been interpreted, then the search radius should approximately be 2000m or larger.
Synchronization
Data displays can be handled from the basemap. This is done if the synchronization is turned off/on for specific items. At present, the synchronization is set globally between the basemap, 2D Viewers and 3D Scene.
If it is turned ON, then the data will be displayed in 3D as well as in 2D Viewers - if launched.
Contrarily, if the sync is turned OFF, you can display on an element from the basemap to a 3D scene / a 2D Viewer. This is done via the right-click menu.
For larger 2D surveys, it is recommended to turn off the synchronization between the 3D Scene and the basemap. This will avoid memory consumption issues and instabilities in large data displays.
Help
It is a standard help button pointing to this documentation.
Trees and Elements
Inline, Crossline and Z-slices
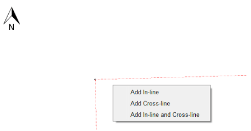
These elements are added in the tree through a right-click menu. The position of the element (Inline and Crossline) is selected by clicking on the basemap. If the synchronization (via the Main Menu) between the 3D scene and basemap is turned ON, the inserted inline will be visible in the 3D scene. Dragging of the elements will not only change the position of the lines but also interactively update the 3D scene if the data is preloaded.
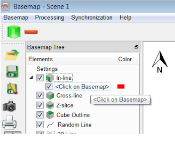
This is an example screenshot of adding an Inline element in the basemap. Note the label along with the tool tip for guide. The same implies for the Crossline.
If a Z-slice is added, it will show the following dialog to sub-select the area of the z-slice. By default, the values will be the survey range.
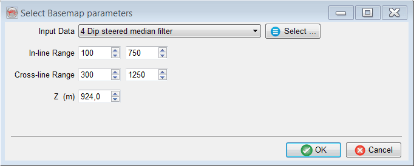
It adds z-slice in the basemap with a given range.
Z-slice also has a right-click menu (tree > z-slice > right-click) containing several options. The properties option will show the positioning dialog to reposition the slice. One can also show the z-slice in a 2D Viewer or in a 3D scene via the right-click menu.
If you intend to add a z-slice in the basemap, we will recommend preloading the data as the seismic data visualization along these slices could be slower.
Alternatively, you can also add inline at a mouse position. This is done via the right-click menu:
Cube Outline
This element displays an outline polygon for a given cube.
Random Line
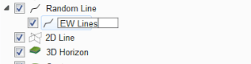
New Lines
In the basemap, random lines can be created as a group or individual sub-elements. Once an individual random line is added in the tree, a user has to click on the basemap to draw its geometry. Once finished, double click to confirm the geometry. The geometry can be manipulated by dragging the line nodes on the basemap. If the data is preloaded, the random line will be interactively displayed in the 3D scene.
Furthermore, one can drag/rotate the line in the 3D scene. Its geometry will be updated in the basemap and vice versa.
Random lines can also be launched in a 2D Viewer to perform interpretation (within the basemap, right-click on the line and choose 2D Viewer).
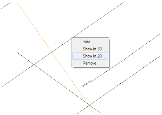
Like other elements, random line also has its own right-click menu giving a flexibility to manage the element.
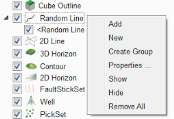
Random line right-click menu

Random line properties
Add Existing Lines
Pre-existing random lines are added using the Random Line > Add right-click menu. When multiple lines are selected a common property (such as line color and line width) is set to all selected lines.
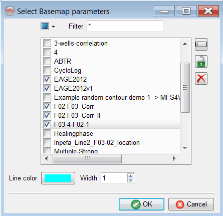
Add selected random lines in the basemap.
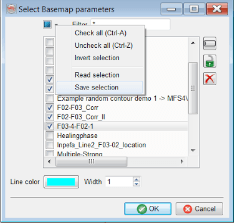
This image shows how to Save selection for future use. Using the same method, one can retrieve the selection by selecting the Read selection option.
Grouping
Random lines can be grouped (Basemap Tree > Random Line > Create Group). In each group, a new random line can be created or an existing random line can be inserted. Sub-groups can also be created using the right-click menu.
To rename a group, double click on the newly added group name.
For the time being, basemap does not support saving of the groups. If you have grouped the random lines in the basemap, we recommend saving the basemap so that you can retrieve the current layout and settings else the set grouping will be lost.
2D Line
2D lines can be added on individual basis or as a group. The latter is preferred if you are dealing with multiple seismic vintages.
If you intend to add many 2D lines in the basemap, we recommend turning the synchronization off between the basemap and 3D Scene. This will speed-up the displays and will give you a freedom to choose what to display in a 3D Scene.
Add Selected Lines
Selected 2D lines can be added in the basemap via the right-click menu (Basemap Tree > 2D Lines > Add). For future use, you may save the selection using the menu available at the top level (a drop-down arrow). This is identical to saving a selection list for the random lines (as mentioned above).
Common line properties (line color and line width) are set to a given selection.
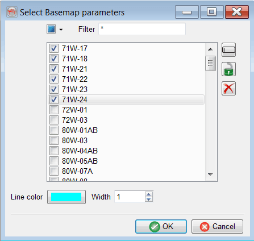
Multiple selection of a list of 2D lines.
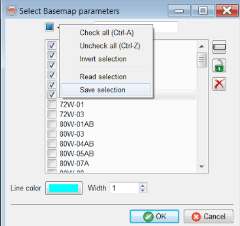
Save selection for future usage.
Grouping
2D lines can be grouped per vintage or as you like. A group contains a list of selection that can be extended at later stages.
If grouping is done in the basemap, we recommend saving the basemap for future use.
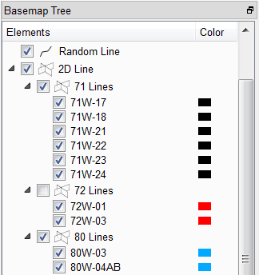
An example structure of grouping a set of 2D lines.
A 2D line group has its own right-click menu to manipulate the displays. Most of the options are self-explanatory. Highlight is the only option that could be used for QC purposes, which highlights the 2D lines on the basemap that have dataset.
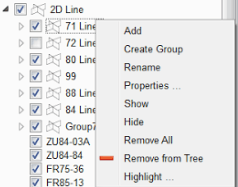
2D Line grouping and a right-click menu.
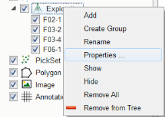
Properties
Line properties can be changed at a group level or at an individual level. Only line color and line width are currently supported.
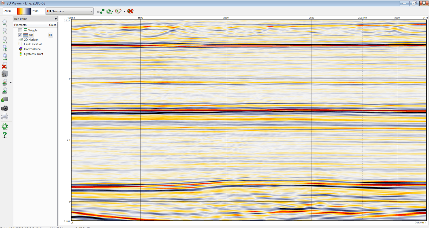
Displaying a 2D Line
A 2D line can be displayed in a 2D viewer or in a 3D Scene. Traditionally, the 2D lines are displayed in a flat viewer such as 2D Viewer in OpendTect. This is done via the right-click menu on the basemap and choosing Show in 2D (as shown below). In such a viewer, one can perform seismic interpretation and continue working with the basemap.
3D Horizon
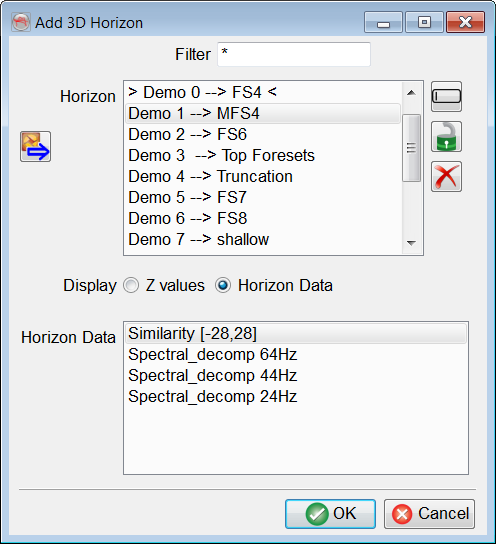
A color coded horizon grid is displayed in the basemap via this tree item. Attributes computed on a horizon can be displayed as horizon data. To add one or more horizons, use the right-click menu from the basemap tree (3D horizon > Add). The color table of the horizon grid can be changed from the color bar shown in the top toolbar (by default).
If you intend to add large number of horizons in the basemap, it is recommended to turn of the Synchronization with 3D (via the Main Menu > Synchronization).
|
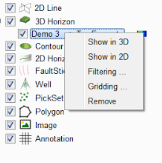
Show in 3D/2D: Shows the selected horizon in a 3D scene or a 2D Viewer. Filtering / Gridding: Each horizon can be individually filtered or gridded by following the right-click menu or from the main menu of the basemap (see under Processing). Remove: Only removes the horizon display from the basemap. |
Note that the order/overlay of the horizon display in the basemap is according to their Z-values (m or ft).
Contour
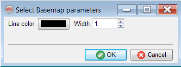
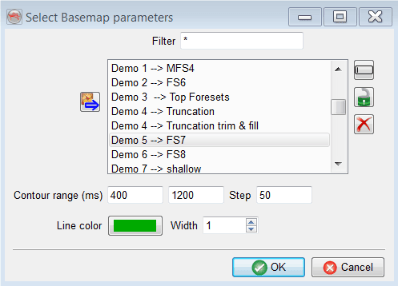
Contoured display of a horizon grid can be added using this tree item. The following window shows the contour range, contour step, and line properties for a selected window. By default, contours are plotted on top of the 3D horizon.
After the display, you can change the contour range/step by right-clicking on the contour item in the tree and choosing the properties option.
2D Horizon
Since version 6.2 2D horizons are displayed as color-coded lines. Grouping feature is also supported for 2D Horizons.
Fault Stick Set
Fault sticks are projected on the basemap and hence may show the spatial location and extent of the fault.
Fault stick properties
FaultSet
The FaultSet is supported in version 6.6.0 and can be displayed in the basemap.
The following shortcut can be used for drawing a polygon in basemap: CTRL+Z CTRL+Y.
Properties can be set for both pointset and polygon.
Well
To add one or more wells in the basemap use the right-click in the basemap tree. Just like other elements (e.g. Random lines / 2D lines), wells can be grouped by creating a group and adding a set of wells in it. If you intend to create such a thing, we recommend saving the basemap.
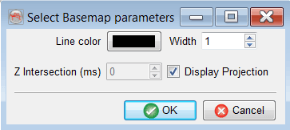
Well properties allow you to control the well symbol, size, and projection.
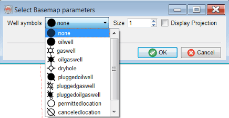
Well properties – Display projection to see the well trajectory.
Pickset
This element is reserved for displaying a point (or pickset) data in the basemap.
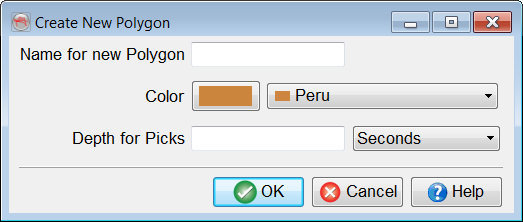
Polygon
This element is reserved for displaying existing polygons or creating new polygons in the basemap.
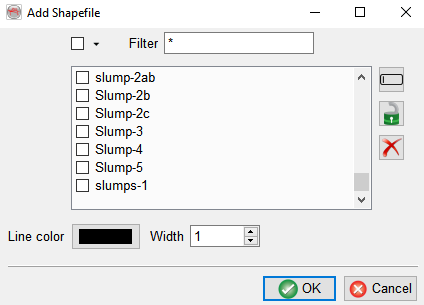
Shapefile
Allows adding shapefiles to the basemap.
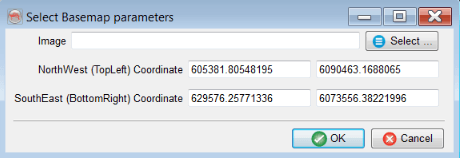
Image
An image (PNG, JPEG, XPM, or BMP) can be added in the basemap. Its coordinates have to be properly added to position it at correct level. An image can have borders, which may not position the image correctly. You can use geo-reference (e.g. QGIS) tools to measure the actual coordinates of the image.
Annotation
To add grid lines on the basemap, this element is used. Grid lines and their annotation can be based on inline / crossline steps or XY spacing.

Toolbars
Main (Top) Toolbar
This toolbar appears (by default) under the main menu of the basemap. It contains the following icon:
![]() Shows the selected item in a 3D scene.
Shows the selected item in a 3D scene.
![]() Removes selected items from the basemap (and/or 3D scene if sync is ON).
Removes selected items from the basemap (and/or 3D scene if sync is ON).
General Toolbar
![]() Open a stored basemap setup.
Open a stored basemap setup.
![]() Save the basemap.
Save the basemap.
![]() Save the basemap with a new name.
Save the basemap with a new name.
![]() Take a high resolutions snapshot of the basemap.
Take a high resolutions snapshot of the basemap.
![]() Prints the basemap on a larger scale (e.g. PDF of A0 size).
Prints the basemap on a larger scale (e.g. PDF of A0 size).
![]() Show or hide the North Arrow in the basemap.
Show or hide the North Arrow in the basemap.
![]() Show or hide the scale bar in the basemap. Scale bar also has settings next to it (small arrow) to change the width of the bar.
Show or hide the scale bar in the basemap. Scale bar also has settings next to it (small arrow) to change the width of the bar.
![]() Show or hide the color bar in the basemap.
Show or hide the color bar in the basemap.
![]() Show/hide the legends in the basemap. Note that this item is editable (click on the text to change it). It can also be freely moved and placed at a desired location on the basemap.
Show/hide the legends in the basemap. Note that this item is editable (click on the text to change it). It can also be freely moved and placed at a desired location on the basemap.
![]() Selects data within the polygon e.g. horizon.
Selects data within the polygon e.g. horizon.
![]() Removes/deletes the selected data.
Removes/deletes the selected data.
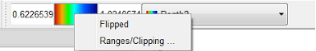
Color Tables
Color tables are linked to 3D horizon grids displayed in the basemap. You can flip the color bar values, clip the range, or manually fill in the numbers.
Title and Printing
Basemap title appears within the basemap. This field is editable (single click on the text and start editing). We support two ways of printing the basemap. The first one is via the Screenshot method, where you can take a high resolution image of the current map. The second one is via the print icon, which allows you to change the orientation (e.g. landscape), and output printer (e.g. PDF if installed).