6.1 Introduction
Automated horizon-tracking, Wheeler transforms, and systems tracts interpretations are unique 3D seismic interpretation capabilities that are supported in OpendTect SSIS; dGB's new Sequence Stratigraphic Interpretation System (SSIS for short).
In SSIS, seismic interpreters are offered new ways of visualizing and analyzing seismic data, which leads to better insights of sediment deposition, erosion, and timing. In combination with OpendTect's neural networks plugin, users can follow up with seismic facies clustering and study the resulting patterns and bodies, and their spatial distribution, in relation to geologic timing and systems tracts.
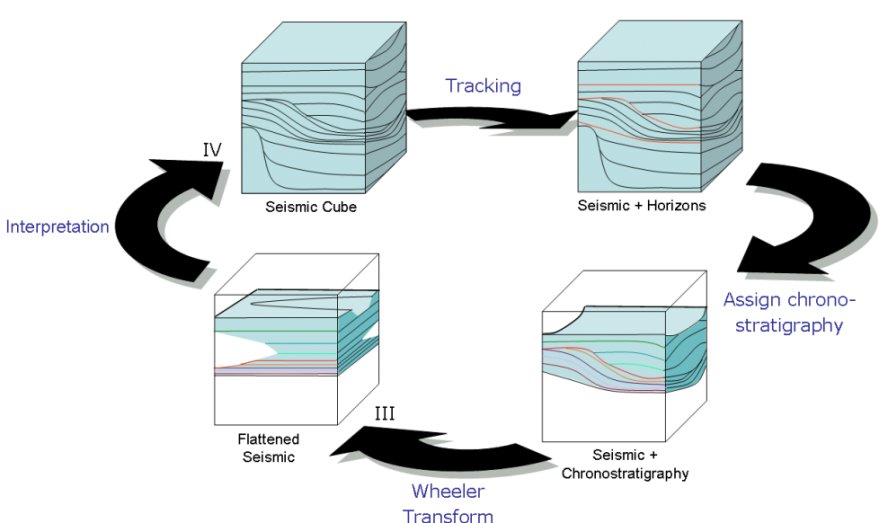
The OpendTect SSIS workflow is an iterative process that consists of four basic steps:
First, major sequence boundaries are interactively mapped with OpendTect's horizon trackers (or these are imported from other interpretation systems). Next, all possible intermediate horizons are auto-tracked with sub-sample accuracy. Each intermediate horizon corresponds to a geologic time line, i.e. a chrono-stratigraphic event, and can be identified by a unique index indirectly to relative geologic age of the event. The index is automatically assigned to each horizon in stratigraphic order according to its relative thickness. Horizons that form the base of one sequence and the top of the sequence below it, are assigned the same index. This index can be manually overruled for both indexes separately. In this way the duration of deposition and duration of hiatuses can be changed. When a horizon is diachronous (time transgressive), the index is the youngest index for the top of a sequence and the oldest index for the base of a sequence.
Two auto-track modes are supported: model driven and data driven. In the model driven approach the HorizonCube is calculated by interpolation or by adding horizons parallel to upper or lower bounding surfaces. In the data-driven mode, seismic horizons are auto-tracked by following the local dip and azimuth of the seismic events. This mode requires OpendTect's dip-steering plugin to pre-calculate the SteeringCube containing the dip and azimuth information.
SSIS Workflow
The third step in the process is the actual Wheeler Transform. Basically, this flattens the seismic data (or derived attributes) along the auto-tracked horizons and honors truncations and erosional/depositional hiatuses. Studying the data in the Wheeler transformed domain increases our understanding of the spatial distribution and timing of sediment deposition. To quote sequence stratigrapher Peter Vail: "You never fully appreciate the implications of a sequence stratigraphic interpretation until you've transformed it to a Wheeler diagram".
The fourth step in the SSIS workflow is systems tract interpretation. Inspecting the spatial distribution of the sequences and lap-out patterns of seismic events, in both the normal domain and the Wheeler transformed domain, enables the user to segment the seismic sequences into systems tract. Systems tracts are specified per HorizoncCube range. To accommodate different naming conventions, the software allows the default systems tract names (High Stand, Falling Stage, Low Stand, Transgressive) to be replaced by user-defined names.
With the HorizonCube calculated and optionally systems tracts interpreted, the user can continue the sequence stratigraphic analysis with seismic facies interpretation. Visualizing systems tract-interpretations together with the HorizonCube and overlaying the normal- and Wheeler transformed domains helps in identifying depositional features of interest. More advanced seismic facies analysis is possible with OpendTect's neural network plugin. Waveform segmentation along any HorizonCube event is a simple and straightforward approach for visualizing seismic patterns per stratigraphic event. Similarly, seismic attributes can be clustered by a neural network to reveal 3D bodies. Further, the user can train a neural network to recognize seismic bodies in 3D from user-defined examples (supervised mode). These approaches have already been supported in OpendTect's neural network plugin. The new version of SSIS allows the results to be visualized and analyzed in the stratigraphic domain, i.e. without distortion by the structure. To appreciate this, you could load (a subset of) a Wheeler-transformed seismic volume (e.g. an attribute, neural network clustered result, or AI cube) in the volume viewer of the Wheeler scene and use the time-slice display to scroll the data. Time slicing in the Wheeler domain corresponds to horizon-slicing in the normal (structural) domain, hence all patterns observed in each slice belong to the same geological event.