8.4.7 Set Process Parameters
The layer modeling settings and various annotations in the profile module can be edited by setting the process parameters. The Set process parameters window can be accessed by clicking on![]() , from the vertical list of icons on the right hand side of the layer modeling window. Also, clicking in the bottom part of the main layer modeling window to add the very first well, pops-up this modeling process parameter selection window.
, from the vertical list of icons on the right hand side of the layer modeling window. Also, clicking in the bottom part of the main layer modeling window to add the very first well, pops-up this modeling process parameter selection window.
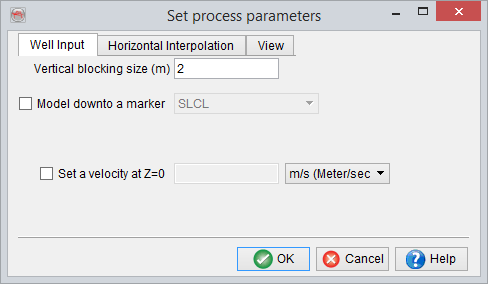
In the first tab (above) of the parameter selection window, a Vertical blocking size for various logs can be specified. Optionally, the model can be limited down to a particular well marker with some additional depth below it. Further, it is also possible to set a user defined surface velocity (i.e. velocity at Z=0). This options particularly comes in handy, when the input (real) Vp/Sonic logs do not start from the surface. Using this option, a reasonable overburden velocity model can be created, as the program will interpolate the velocity information between the surface (i.e. Z=0) and the first velocity sample in the well logs. If this option is not used, the top most velocity value from the well logs will be assigned to all the layers above, up to the surface.
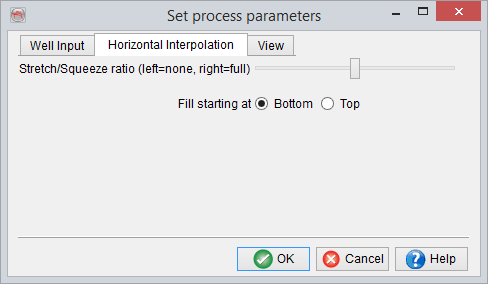
The second tab (below) parametrizes how the horizontal interpolation is done between the wells (and/or control profiles) of various log data. At a certain point in time, the program needs to generate a new profile between two 'fixed' profiles - Two wells, or a well and a control profile, or two control profiles. In general the thickness, at the new profile location, will not be the same as any of the two controlling profiles. If a full stretch/squeeze ratio is used, then all layers from both 'fixed' profiles will be present. If no stretch/squeeze ratio is used, then two things are possible - Either cut the extra layers from top (Fill starting at Bottom) or cut layers from the bottom (Fill starting at Top). However, the using full stretch/squeeze may be rather non-geological and no stretch/squeeze is somewhat non-flexible. Therefore, the default option is a combination of the two and is the use of 50% stretch/squeeze ratio, for the horizontal interpolation.
For example, consider a scenario, where there are 10 layers on the left and 5 layers on the right (both sides blocked at 1m), and the program has to draw a profile in the middle which obviously is going to have a layer thickness of 7.5 meters. Now, the use of full stretch/squeeze ratio option is going to fill this 7.5m thickness with all the layers, by squeezing them in. If no squeezing/stretching is used, either the top 7.5 layers or bottom 7.5 layers can be outputted. If the default 50% stretch/squeeze ratio option is used, either the top 8.5 layers or bottom 8.5 can be squeezed in the total thickness of 7.5 meters, at the new profile location.
It may also be noted that geologically speaking, cutting the top layers out or Fill starting at Bottom is a more sensible option.
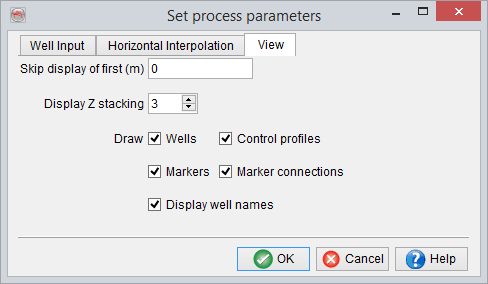
Finally, the third tab of the parameter selection window, controls the display options for the layer model. Here, it is possible to Not display the layer model down to a user defined depth, starting from the surface (i.e. Z=0). Also, it is possible to display the layer model in a blocky manner, by stacking a number of vertical blocks (block size defined in the first tab), using the Display Z stacking option. For example, if vertical blocking size of the well log data is defined as '2' meters and the default Z stacking of '3' is used, three adjacent vertical blocks (of 2 m thickness each) will be stacked together, only for display. Next, it can be chosen, whether to draw or not, the annotations for various elements of the layer model - Wells, Control Profiles, Markers, Marker connections and Well names.