5.3.3 Cross-Plot Window
The cross-plot window shows the data previously extracted and shown the cross-plot . The window may start empty if insufficient data was selected in the table window.
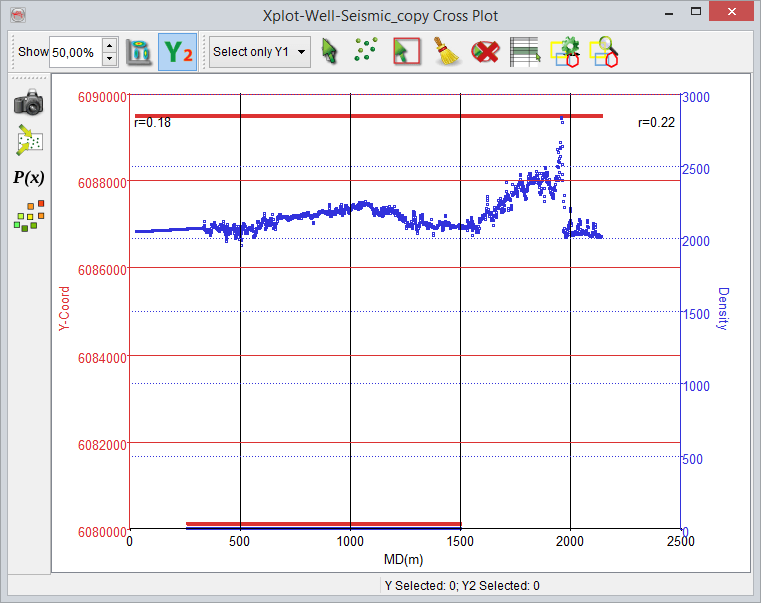
The cross-plot window contain three toolbars to perform various tasks:
Crossplot manipulation toolbar
![]() Take the snapshot of the cross-plot.
Take the snapshot of the cross-plot.
![]() Gives access to the main crossplot window properties: scaling, statistics, regression line, density plot parameters.
Gives access to the main crossplot window properties: scaling, statistics, regression line, density plot parameters.
![]() Creates multivariate from the cross-plot data.
Creates multivariate from the cross-plot data.
![]() Colour code the points with respect to a .
Colour code the points with respect to a .
![]() Colour code the points with respect to the wells they were collected.
Colour code the points with respect to the wells they were collected.
Crossplot display toolbar
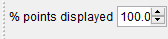 Is used to update the amount of displayed scattered points in a cross-plot. It increases the efficiency to display the data quickly. Normally, a huge data slows down the machine performance, when displayed as scattered points. To avoid this, this option is used to display a selected percentage of the points. Moreover, the percentage is only set for the data that has values; undefined values are ignored in the percentage.
 The scattered points of individual/all wells are displayed.
![]() Used to show a coloured density cross-plot. Normally, if the displayed scattered data points are too large, it consume huge memory to display the data. In that case, the density plots are useful. In a density plot the data will not be filtered out in the display (% point displayed) as in the case of a scattered point display. In the cross plot properties window, there is a tab available for the . In that tab, a user can set a number (currently displayed data) to display the data. When this plot is ON, there will be a colour table displayed that can be changed. The colour spectrum designates the distribution of the points per pixel.
Used to show a coloured density cross-plot. Normally, if the displayed scattered data points are too large, it consume huge memory to display the data. In that case, the density plots are useful. In a density plot the data will not be filtered out in the display (% point displayed) as in the case of a scattered point display. In the cross plot properties window, there is a tab available for the . In that tab, a user can set a number (currently displayed data) to display the data. When this plot is ON, there will be a colour table displayed that can be changed. The colour spectrum designates the distribution of the points per pixel.
![]() Used to Toggle on/off the second Y-axis (Y2) scattered points. It may be noted that when the second Y-axis (Y+) is selected to be cross plotted against Y1 and X, the data points may become too large to be displayed. Therefore, in this case, the system will prompt a warning to display a given percentage of the data (% points displayed).
Used to Toggle on/off the second Y-axis (Y2) scattered points. It may be noted that when the second Y-axis (Y+) is selected to be cross plotted against Y1 and X, the data points may become too large to be displayed. Therefore, in this case, the system will prompt a warning to display a given percentage of the data (% points displayed).
Crossplot selection toolbar
 Is inactive, if a cross-plot is created with one Y-axis. It allows to make section of the scattered points. The selection settings (Select only Y1/Y2, both) are important to remove unwanted points from the extracted data. When dual Y-axis are cross-plotted, a user can select individual or both Y-axis points by changing this option.
![]() Toggles a pan/selection mode. Selection mode is used to select the scattered points. When pan is toggled on, rest selection options (see below) become inactive, which avoids editing/manipulation of the cross-plotted data.
Toggles a pan/selection mode. Selection mode is used to select the scattered points. When pan is toggled on, rest selection options (see below) become inactive, which avoids editing/manipulation of the cross-plotted data.
![]() Used to display the selected scattered point in an active scene. The selection of the data points is done by using selection mode. By using this option, the selected scattered data can be saved as a pointset/body. Right-click on a point in a scene and from the pop-up menu select 'save as a pointset' or 'create body' option.
Used to display the selected scattered point in an active scene. The selection of the data points is done by using selection mode. By using this option, the selected scattered data can be saved as a pointset/body. Right-click on a point in a scene and from the pop-up menu select 'save as a pointset' or 'create body' option.
![]() Selection mode (rectangle/polygon). The selection is made by holding the left-mouse button down and selecting the desired area within the cross-plot.
Selection mode (rectangle/polygon). The selection is made by holding the left-mouse button down and selecting the desired area within the cross-plot.
![]() Used to de-select the selected data points (using selection mode tools).
Used to de-select the selected data points (using selection mode tools).
![]() The unwanted data points can be removed by using selection mode and this trash button. In order to remove the data points of Y1, Y2 or both, use selection mode tools to select an area within which the data is to be removed. After that press this button to remove the data.
The unwanted data points can be removed by using selection mode and this trash button. In order to remove the data points of Y1, Y2 or both, use selection mode tools to select an area within which the data is to be removed. After that press this button to remove the data.
![]() Used to select the data from a cross-plot and display the corresponding selected data in the spread-sheet (Well/Attribute data window).
Used to select the data from a cross-plot and display the corresponding selected data in the spread-sheet (Well/Attribute data window).
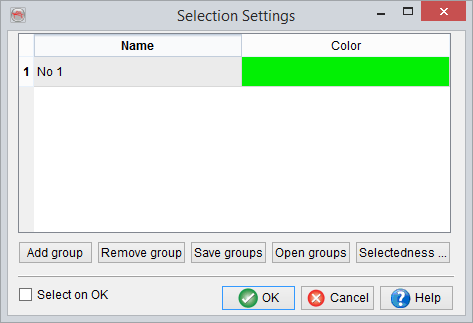
![]() You can do multiple selections by adding new groups (see below). It is launched using this manage selection button. The multiple group selection allows you to select different clusters/trends on a crossplot in the form of groups. Second and subsequent selections are made by clicking on a group name and holding the CTRL key down from a keyboard prior. Then the corresponding polygon (with a given colour) is drawn over the crossplot display area. It is a very useful tool for reservoir prediction and characterization.
You can do multiple selections by adding new groups (see below). It is launched using this manage selection button. The multiple group selection allows you to select different clusters/trends on a crossplot in the form of groups. Second and subsequent selections are made by clicking on a group name and holding the CTRL key down from a keyboard prior. Then the corresponding polygon (with a given colour) is drawn over the crossplot display area. It is a very useful tool for reservoir prediction and characterization.
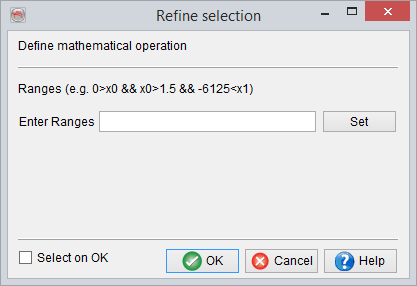
![]() This option is used to by using a mathematical logic over a range. It restricts the selection according to the range set in the Refine Selection window (a pop-up window invokes when this button is pressed). For instance, a user may want to remove a data (x0) within a range of 3-4 from a cross-plot in which 1-2 values are overlapping. To do that, press this button to launch Refine Selection window. In the Enter Ranges field, an equation can be set i.e. X0 > 3 and X0 < 4. Where X0 is desired data in a cross-plot. After this a section can be made within a cross-plot to remove values within the polygon according to the equation.
This option is used to by using a mathematical logic over a range. It restricts the selection according to the range set in the Refine Selection window (a pop-up window invokes when this button is pressed). For instance, a user may want to remove a data (x0) within a range of 3-4 from a cross-plot in which 1-2 values are overlapping. To do that, press this button to launch Refine Selection window. In the Enter Ranges field, an equation can be set i.e. X0 > 3 and X0 < 4. Where X0 is desired data in a cross-plot. After this a section can be made within a cross-plot to remove values within the polygon according to the equation.