11.8 Frequency
Name
Frequency -- Response attribute that returns frequency properties
Description
Input Parameters
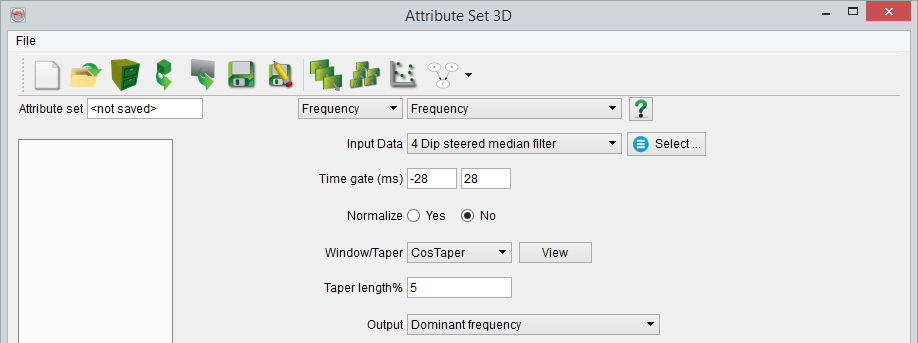
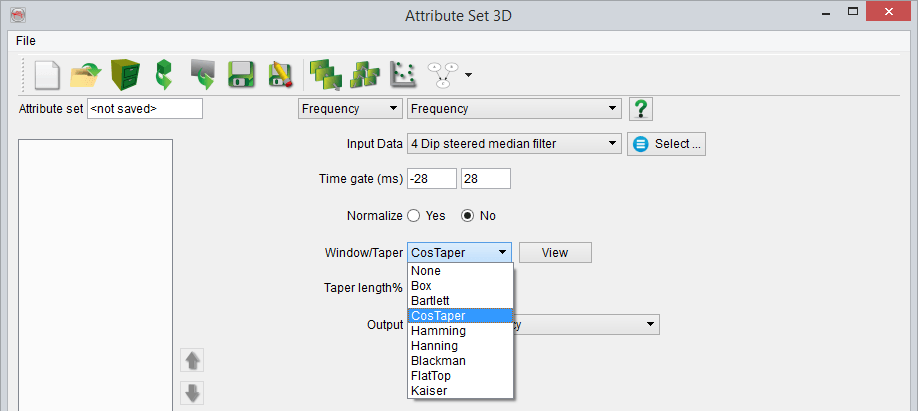
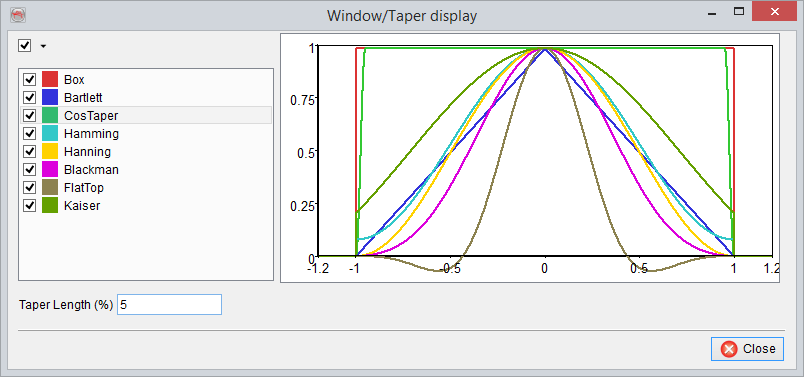
The specified time-gate is transformed to the Fourier domain and the requested output is calculated. The time-gate is tapered with the specified Window/Taper prior to Fourier Transform. The shape of the various tapers is shown in the figure below.
If Normalize is enabled, the frequency spectrum is normalized with regard to its area. This will make it possible to compare attributes from areas with high and low energy.
Output
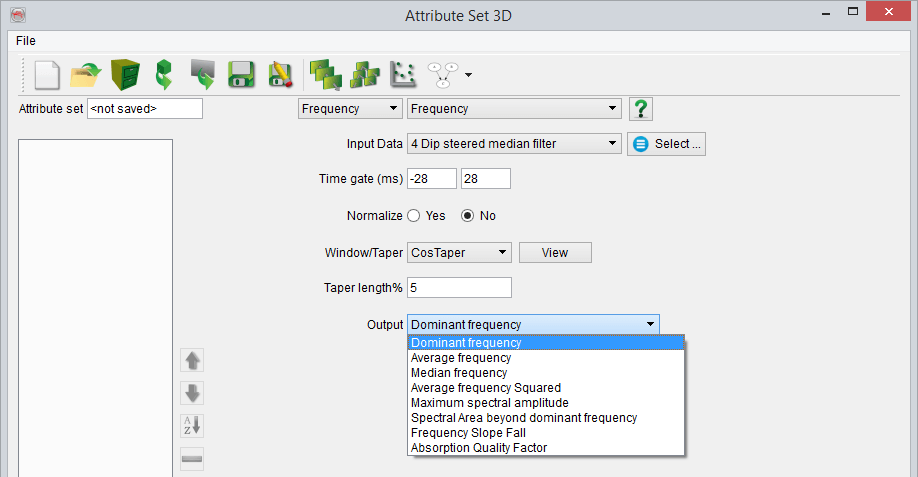
All possible Frequency outputs are in X-axis, Y-axis = Amplitude values
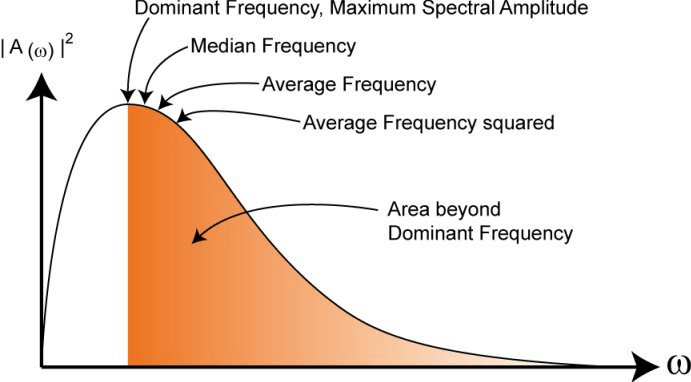
Dominant frequency
Returns the dominant frequency from the frequency spectrum--the frequency with the highest amplitude
Average frequency
Returns the arithmetic mean of the frequency spectrum.
Median frequency
Returns the weighted median value of the frequency spectrum, which is the frequency at half the spectral area on each side. The median frequency might be somewhat more robust than average frequency, at the cost of lower precision.
Average frequency squared
Returns the average of the squared frequencies.
Maximum spectral amplitude
Returns the maximum amplitude of the frequency spectrum, i.e. the amplitude of the dominant frequency.
Spectral area beyond dominant frequency
Returns the spectral area beyond the dominant frequency (see figure below).
Absorption quality factor
Returns the area beyond the dominant frequency weighted by frequency.
Frequency slope fall
Returns the peakedness of the spectrum. It is defined as: 1+(MSA-Spectral Area)/(MSA+Spectral Area). A value approaching zero indicates a flat distribution while a value approaching one indicates a peaked distribution.