11.27 Texture
Name
Texture -- Group of attributes that return statistical properties of a Grey-Level Co-occurrence Matrix (GLCM)
Description
The texture attributes implemented in OpendTect are described in detail in the GLCM Texture Tutorial by Mryka Hall-Beyer.
GLCM texture attributes come from image processing and were developed to capture roughness / smoothness of an image. The attribute response is calculated in two steps: First the GLCM is computed for an area (volume) around the evaluation point. Secondly a statistical property from the GLCM is returned. The GLCM is a 2D matrix that captures how often the neighbor values A and B occur in an image. Look at the GLCM as a matrix of N x N dimensions that captures the amplitude response of the reference position in the columns and the amplitudes of the neighboring position in the rows. N is the range of all values the data can have. Let's say we have a data set in which amplitudes can have values 0,1,2,or 3 (GLCM matrix is 4 x 4). We then fill the matrix by comparing each amplitude in the input area (volume) with its direct neighbor and increase the occurrence of the corresponding matrix cell. The matrix is made symmetrical by comparing neighbors in both directions: reference vs neighbor and neighbor vs reference, and it is normalized by dividing through the total number of occurrences. The normalized GLCM matrix is a kind of a probability matrix that tells us how probable it is to find pairs of neighboring amplitudes in the area (volume) around the evaluation point.
In OpendTect the GLCM is computed on re-scaled data. The input data is re-scaled linearly to 4-bits (values ranging from 0 to 15; GLCM 16 x 16), or to 5-bits (values from 0 to 31; GLCM matrix 32 x 32). To re-scale the data the user must give the clipping range of the input data. Neighbors are compared in the inline and cross-line directions. The matrix is further filled by looping over the user-defined time-gate. Note that when dip-steering is used the input extraction area (volume) follows the local stratigraphy, which leads to better responses in dipping strata.
Texture attributes in seismic interpretation are typically used in facies analysis. They can be used in their own right, or (when you have access to the Neural Network plugin) as inputs to a neural network to create 3D seismic facies volumes. This can be done in a supervised approach (MLP network), or in an unsupervised approach (UVQ network).
Input Parameters
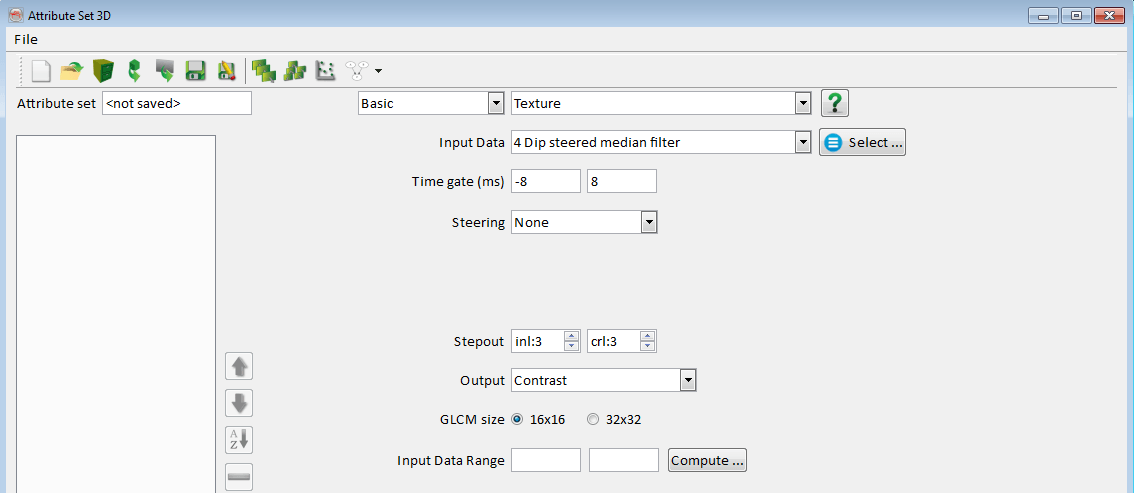
Time-gate, step-out and Dip-steering (optional; requires Dip-steering plugin) settings determine the input area (volume) for which the GLCM matrix is computed. Larger step-outs results in smoother outputs that will follow the stratigraphy better if dip-steering is used.
GLCM-size is the size of the GLCM matrix. 32 x 32 may give somewhat sharper outputs at the expense of more CPU time.
Input Data Minimum and Maximum define the clipping range of the data, which is needed to rescale the data to 4-bits (16 x 16), or 5-bits (32 x 32).Input data range is automatically calculated from the compute option.In the "analysis" window number of traces need to be selected which computes the scaling range from the selected input traces.
Output
OpendTect supports three groups of Texture Attributes:
- Contrast group: Measures related to contrast use weights related to the distance from the GLCM diagonal along which neighboring values are equal. Attributes in this group: Contrast, Dissimilarity, Homogeneity
- Measures related to orderliness. Attributes in this group: Angular Second Moment (ASM), Energy, Entropy
- Group using descriptive statistics of the GLCM texture measures. Attributes in this group: GLCM Mean, GLCM Variance, GLCM Standard Deviation, GLCM Correlation
In all equations given below N denotes the size of the GLCM matrix; i refers to the column and j to the row. P is the GLCM Probability matrix.
Contrast
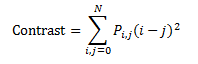
When i and j are equal, the cell is on the diagonal and (i-j)=0. These values represent amplitudes entirely similar to their neighbor, so they are given a weight of 0.
If i and j differ by 1, there is a small contrast, and the weight is 1.
If i and j differ by 2, contrast is increasing and the weight is 4.
The weights continue to increase exponentially as (i-j) increases.
Dissimilarity
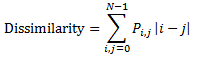
In Dissimilarity the weights with which GLCM probablities are multiplied increase linearly away from the diagonal (along which neighboring values are equal).
Homogeneity
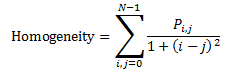
Dissimilarity and Contrast result in larger numbers for more contrasting windows. If weights decrease away from the diagonal, the result will be larger for input areas (volumes) with little contrast. Homogeneity weights values by the inverse of the Contrast weight, with weights decreasing exponentially away from the diagonal.
Angular Second Moment
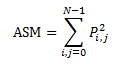
ASM and Energy use the GLCM probability as a weight for itself. The name for ASM comes from Physics, and reflects the similar form of Physics equations used to calculate the angular second moment, a measure of rotational acceleration. High values of ASM or Energy occur when the input area (volume) is very orderly.
Energy
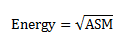
See above.
Entropy
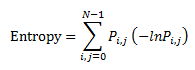
Entropy is the opposite of energy; it is a measure of chaos. In physics (thermodynamics) entropy refers to the quantity of energy that is permanently lost to heat ("chaos") every time a reaction or a physical transformation occurs. Entropy cannot be recovered to do useful work. Because of this, the term is used in non technical speech to mean irremediable chaos or disorder. Also, as with ASM, the equation used to calculate physical entropy is very similar to the one used for the texture measure.
GLCM Mean
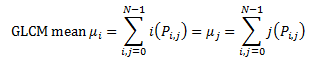
The left hand equation calculates the mean based on the reference pixels, i. The right-hand equation calculates the mean over the the neighbor pixels, j. These two values are identical because OpendTect computes a symmetrical GLCM, where each amplitude is counted once as a reference and once as a neighbor.
GLCM Variance
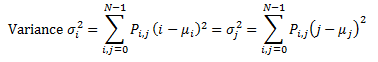
Variance is a measure of the dispersion of the values around the mean. It is similar to entropy. It answers the question "What is the dispersion of the difference between the reference and the neighbour pixels in this input area (volume)?"
GLCM Variance in texture measures performs the same task as does the common descriptive statistic called variance. It relies on the mean, and the dispersion around the mean, of cell values within the GLCM. However, GLCM variance uses the GLCM, therefore it deals specifically with the dispersion around the mean of combinations of reference and neighbor amplitudes, so it is not the same as variance of input amplitudes that can be computed with the "Volume Statistics" attribute.
Variance calculated using i or j gives the same result, since the GLCM is symmetrical.
GLCM Standard Deviation
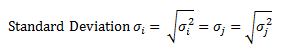
There is no particular advantage to using Standard Deviation over Variance, other than a different range of values.
GLCM Correlation
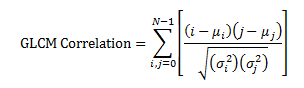
The Correlation texture measures the linear dependency of input amplitudes on those of neighboring amplitudes.
GLCM Correlation is quite a different calculation from the other texture measures described above. As a result, it is independent of them (gives different information) and can often be used profitably in combination with another texture measure. It also has a more intuitive meaning to the actual calculated values: 0 is uncorrelated, 1 is perfectly correlated.
GLCM Correlation can be calculated for successively larger window sizes. The window size at which the GLCM Correlation value declines suddenly may be taken as one definition of the size of definable objects within an image.
If the input is completely uniform the GLCM variance is 0 and the correlation function is undefined. OpendTect will in that case return the value 1.
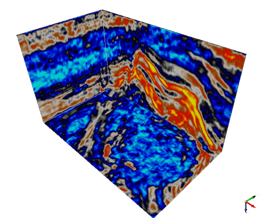
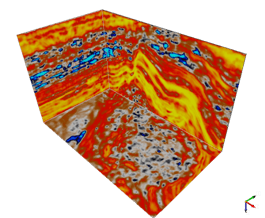
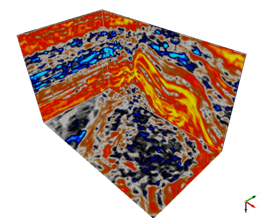
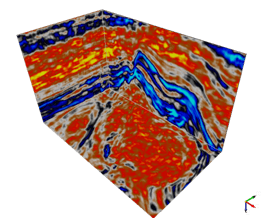
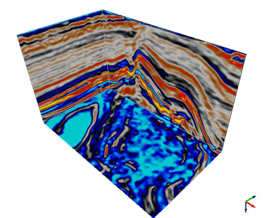
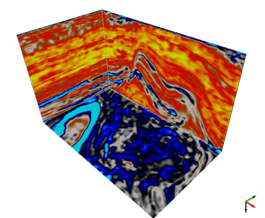
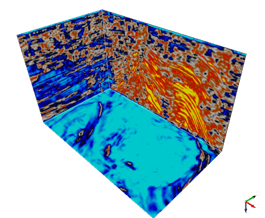
Examples
DS in the examples below stands for Dip-Steering.
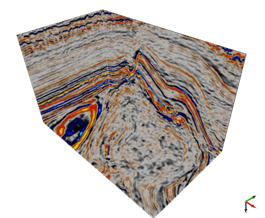
Seismic |
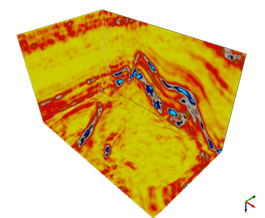
Contrast: 3 x 3 x [-8,8], DS |
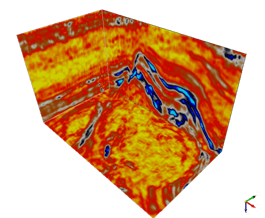
Dissimilarity: 3 x 3 x [-8,8], DS |
Homogeneity: 3 x 3 x [-8,8], DS |
ASM: 3 x 3 x [-8,8], DS |
Energy: 3 x 3 x [-8,8], DS |
Entropy: 3 x 3 x [-8,8] |
GLCM Mean: 3 x 3 x [-8,8], DS |
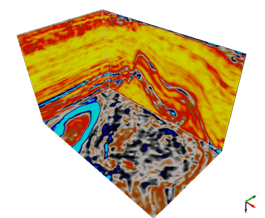
GLCM Variance: 3 x 3 x [-8,8], DS |
GLCM Standard Deviation: 3 x 3 x [-8,8] |
GLCM Correlation: 3 x 3 x [-8,8], DS |
References
- Chopra, S. and Alexeev, V., 2005. Application of texture attribute analysis to 3D seismic data. CSEG Recorder, Sep. 2005 pp 29-32.
- Hall-Beyer, M. GLCM Texture Tutorial. Available: Online [Accessed 9 Oct. 2012].