2.4 Color Tables
A colortable is a predefined group of color settings that can readily be applied to any attribute. This group includes items such as the primary colorbar, undefined color settings, color segmentation, and opacity. Changes made to the colortable are applied universally to any item that uses that colorbar.
A colorbar is the specific colortable for a particular element's (line/horizon) attribute that is displayed in a scene. Updating the colorbar can update the selected element's attribute. The image below is an example colorbar:

The colorbar is composed of four elements: the color display itself, the minimum and the maximum value of the variation for the colortable (as it is defined for the currently selected item), and a set of colortables.
This drop down list of predefined colortables appears when the user clicks on the name of the colortable being used in the colorbar (ex: Channels). If no item is selected in the tree, the colorbar will not show any value/range although it can be manipulated. The colortable is manipulated by right-clicking on the colorbar.
The pop-up sub-menu contains several manipulation functionality. These are described in the following:
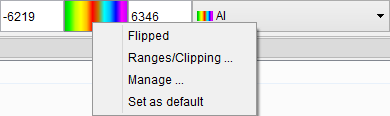
Flip causes the scale to be flipped. (The color assigned to the high value, now becomes the color assigned to the low value, etc.)
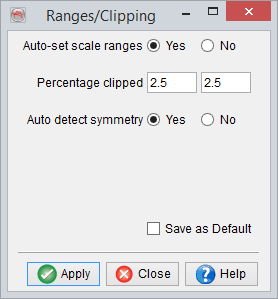
Ranges/Clipping allows the user to change the range of the color scale, or clip a certain percent of the scale. Please be aware that because of display time consuming, only 2000 random sampling points are by default used to clip data. The clip values thus change from one data set to another.(An alternate method for clipping is described in the Inline, Crossline & Z-slice sub-chapter).
Set as default sets the current color settings as the default color scheme for all elements in the tree.
Manage is used to modify the current colortable and to create new colortables with the current one as a starting point. Colortables are modified by adding, removing, changing colors, varying opacity, and defining the colorbar to be gradational or segmentized. The effect of the changes on your displayed element can be seen directly. Colortables can be removed from the list by pressing the Remove button. (OpendTect Default colortables can not be removed). Moreover, the user can import user-defined colortables by pressing the Import button.
Colortable Manager window
The Colortable Manager window opens when the user selects the Manage option described above.
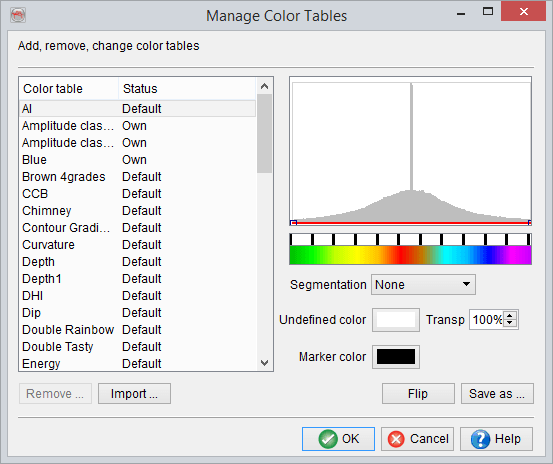
A marker is the color you see in the colorbar. The black lines, in the white field above the colorbar, are the marker boundaries. The marker boundaries are where the settings for the markers are defined. Right-clicking on a marker boundary shows the following options: Remove color, Change color, and Edit Markers.
Remove color deletes the marker boundary from the colortable.
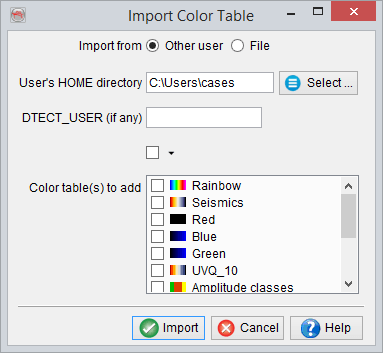
Import colortable file: The colortables can also be imported by pressing the From other user... button. The default colortables are stored in a file (ColoTabs) that is located in the OpendTect installation directory (e.g. /home/your-username/opendtect/6.6.0/data/ or C:\Program Files\OpendTect\6.6.0\data\). Moreover, the colortables saved by a user are stored in a file (settings_coltabs.user) that is located in the user home directory (e.g. $HOME/.od/ or C:\Users\your-username), here user is the OpendTect username. These files can be modified or imported by using import color table window (see below).
Marker color brings up a standard color definition window, where this defined color can be changed.

Edit Markers opens the Manage Marker window that displays all markers: marker ID, position, and current color. The marker's position, in relation to low and high values, can be specified by number. The standard color definition window can be opened from here too, by double-clicking the marker color.
Opacity: A thin red line, capped on each end by small red nodes, is visible at the bottom of the histogram located in the top panel. By moving these nodes, or adding additional nodes, the user can vary the opacity of the colors below. One can add opacity nodes by double-clicking in this area. These opacity nodes can be dragged up or down to increase or decrease, respectively, the transparency of the color directly below it in the colorbar. A hatched area (visible in the color toolbar in the main window of OpendTect) indicates the part of the color bar that will display with some level of transparency. The darker the color of the hatch marks, the higher the level of transparency.
Transparency performance depends on the graphics card. When displaying two elements in exactly the same position, transparency may not work as you expect. It may help to set transparency values to the maximum to get the sort of display you desire. In addition, it may help to change the transparency of the element as a whole by right-clicking the element in the tree, and selecting Properties.
In the background of the opacity panel, a histogram is shown in light grey. This histogram shows the distribution of attribute values in the selected element. This helps you to tune the colorbar to the value range you may want to highlight. To alter the histogram see Show Histogram in the Inline, Crossline & Zslice sub-chapter.
Segmentation allows the user to segment the colorbar into a user-defined discrete number of colors. This can be done in a Fixed or Variable manner. Fixed allows the user to define the number of segments they would like to have, but does not allow the marker boundaries to be moved. Variable allows the user to both define the number of segments, and move the marker boundaries to suit specific needs. Fixed is good for purposes such as velocity and contour lines, while Variable is good for use with waveform segmentation.
Undefined color specifies the color that will be used to display undefined values in the data.
Color Table Manual Creation
Color tables can be created manually from the color table manager, and can be imported from external files, provided that the relevant format is used.
The easiest method by far for adding a new colorbar would be to copy one from the software template: the file ColTabs is in the root of the application folder (ie: C:\Program Files\OpendTect\6.6.0\data or equivalent). Note that the color tables are discrete, i.e. it is encoded by a fixed number of points for which a color (RGB) and transparency (Alpha) is provided. Values in between are interpolated. It is up to the creator of the color table to decide how many points are needed to correctly represent it.
For one point, each row should be looking like:
XX.Value-Color.YY: POS`Red`Green`Blue`Alpha
where XX is the colorbar index within the file, YY is the sequential point index within a colorbar (0 to N-1), and POS is the relative point position, from 0 (left/bottom) to 1 (right/top).