5.2.2.1 3D Slider - HorizonCube Visualization
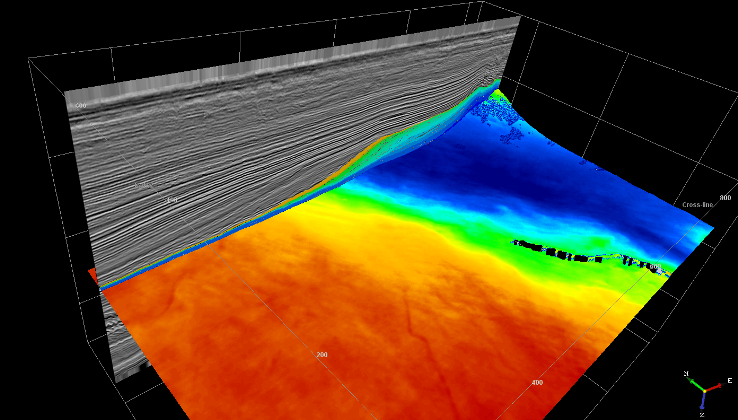
A tool that is not only used to visualize the HorizonCube events in 3D but also to interpret depocenter, pinchouts, geologic bodies based on thickness /attribute map views along the events. The thicknesses are computed on the fly and are displayed as a grid on the horizons. From the isopach maps one may furthermore create bodies. Another benefit of the 3D slider is to save the key events as conventional OpendTect horizons.
Preload HorizonCube
A user must preload a HorizonCube into the memory.
If the HorizonCube is big and there is insufficient RAM installed on the system, you may preload a package.
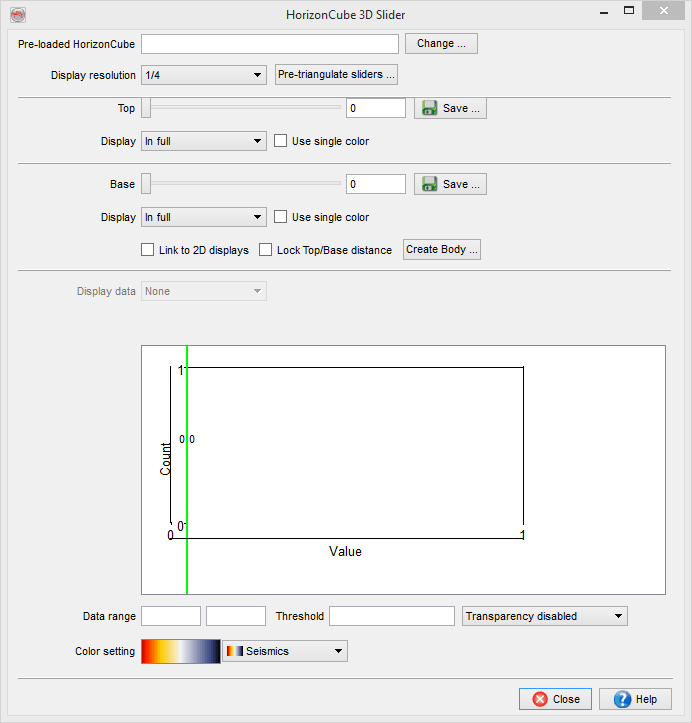
Top/Bottom Slider(s)
There are two sliders available to display the corresponding events in the scene and also to compute the isopach thicknesses between the events. The user has an option to hide either event.
Link to 2D displays
It links the (top/bottom) sliders movement to the sections (inlines/crosslines) on which the preloaded HorizonCube is displayed. So, if the slider is moved, the corresponding HorizonCube overlay on sections will also be moved.
Lock top-bottom distance
It is used to lock the number of events between the sliders positions. Once it the number of events are locked, one may use only one slider to compute the isopach between them.
Body
It is used to create a body object within OpendTect. The body can be created either within a polygon or by using mentioning the threshold value. The threshold value is the position of the red line in the histogram of the 3D Slider. The polygon is selected if a pre-defined polygon exists. If not, you will have to create a polygon first (for details please read the pickset/polygon section of the User Documentation). The second mode i.e. Automatic filling requires a threshold value. For instance, if one wants to create the bodies of all isopach values that have 0.25sec thickness, 0.25 should be given as a threshold. Optionally, one could move the red line in the slider to provide that value. The body is filled either with values that are below the threshold or with the values that are above the threshold. These are set in the Body value radio boxes.
The body is created within a selected polygon and between the two HorizonCube events positioned using the slider.
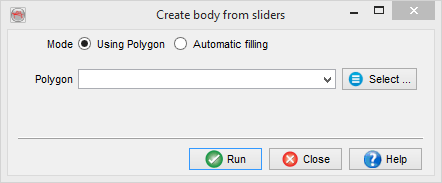
Create bodies from the 3D Slider
Surface data
Nothing will be computed on the displayed (Top/base) events in the scene.
Depth: Will display the Z-values (TWT / Depth) along the events.
Top-Base Isopach: It computes the isopach thickness between the two events selected by a user at particular sliders position. Once the user presses the Calculate button, the histogram of the thickness is displayed. The histogram display can be used to define the transparency on the thickness map. The green lines on the top of the histograms define the clipping of the histogram. The red line on the histogram is used to define the transparency.
New Attribute: It is used to compute a stored seismic volume or a defined attribute along the horizons.
Transparency
This field defines the transparency range on a colour bar. The first two fields adjacent to the transparency are the colour ranges. The third field is the transparency cut-off value. Disable option in the list box defines no transparency, above defines transparency above a given cut-off value and below defines transparency below the cut-off value.
Colour bar
The colour ranges and the corresponding selected colour bars are available at the bottom. The active colour bar is used to display the thickness map on the displayed horizons. The colour bar can interactively be changed by scrolling the available list of pre-defined colour tables. Furthermore, one may right click on the colour bar and use the pop-up menu that work similar to the general OpendTect colour bar.