3.7.3.4 Variogram
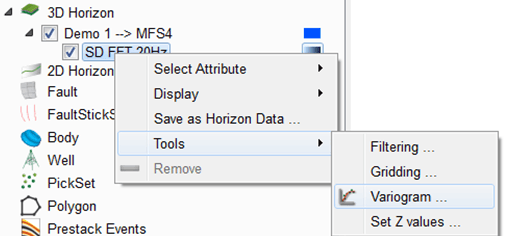
For any horizon data displayed on a horizon, a horizontal variogram can be computed:
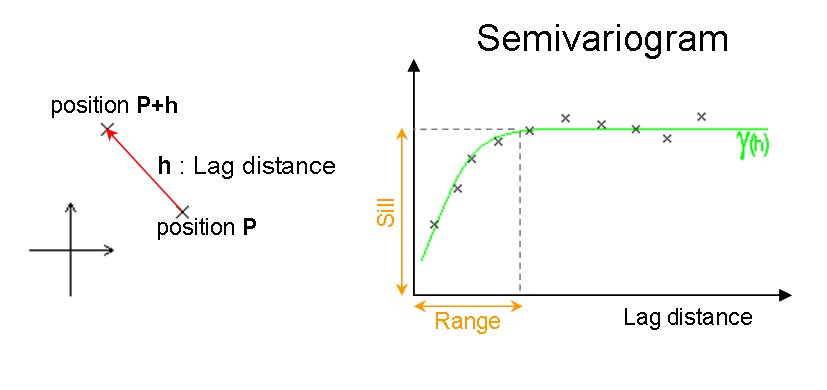
The variogram describes the spatial continuity, here in the horizontal direction but it can also be computed vertically from the crossplot tool. It is commonly represented as a graph that shows the variance in measure with distance between all pairs of sampled locations. Modeling of relationship among sample locations to indicate the variability of the measure with distance of separation is called Semivariogram or Variogram modeling. Variograms are important when doing inversion as it allows to predict a value at a location where it has not been measured.
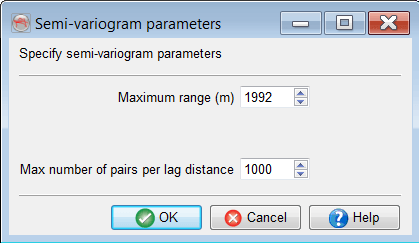
To compute the variogram, parameters need to be provided: the maximum range (maximum distance allowed between the pairs for the analysis), the step and the minimum pairs per log distance:
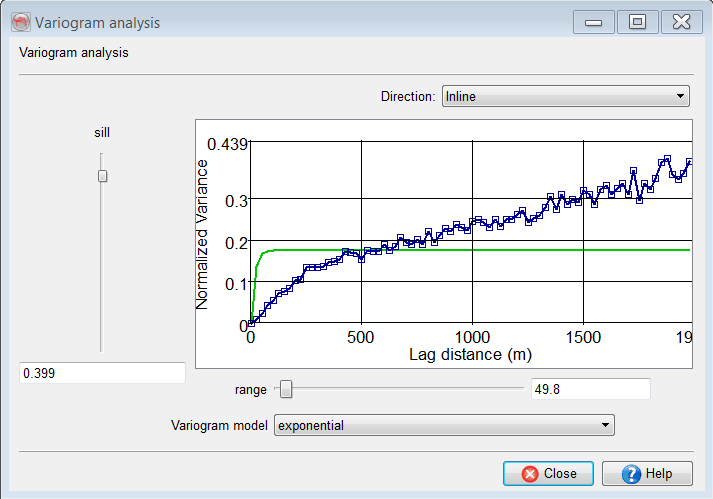
Once the variogram has been created, the analysis consists in finding the model that best fits the measured data in changing the variogram type and changing the sill and range: