6.4.2 Create Postscript Maps
Several tabs have been arranged to specify the respective settings. The later part of this section shows a typical OpendTect example of a postscript map.
- Basemap: This tab is used to set the scale of the map and other map settings.
- Contours: It is used to create a horizon contour map.
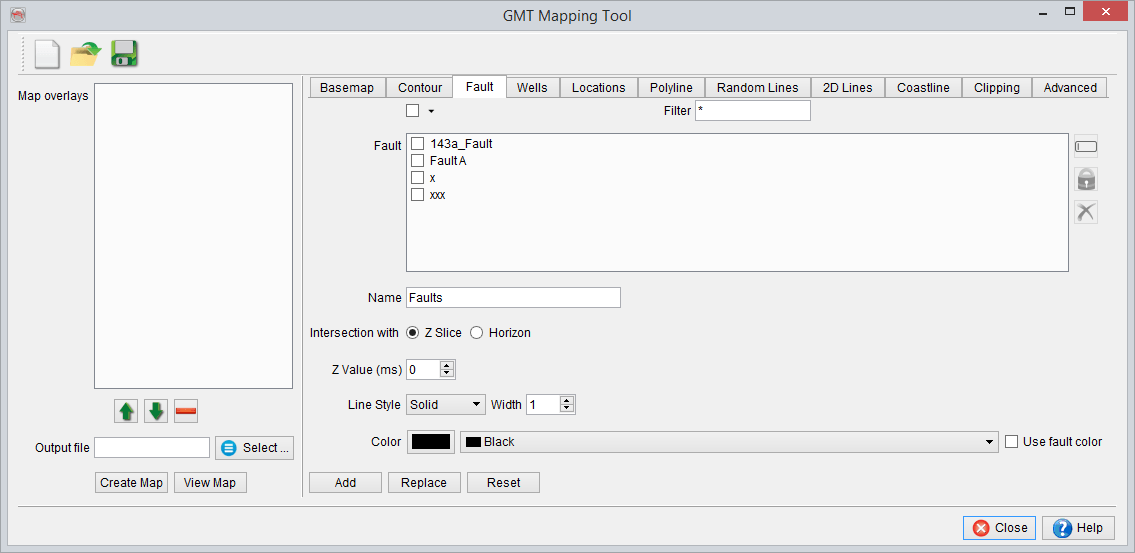
- Faults: It is used to post the intersection of faults with constant times or the intersection with a surface.
- Wells: It is used to post wells in the map.
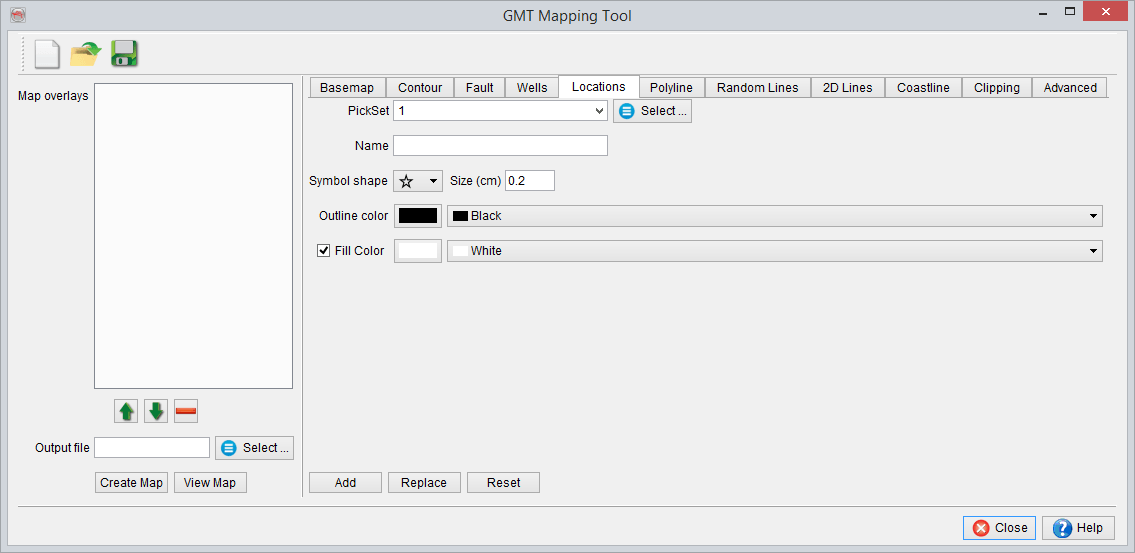
- Locations: It is used to post pointset data in the map overlay.
- Polyline: It is used to add polygons (e.g. lease boundaries) in the map overlay.
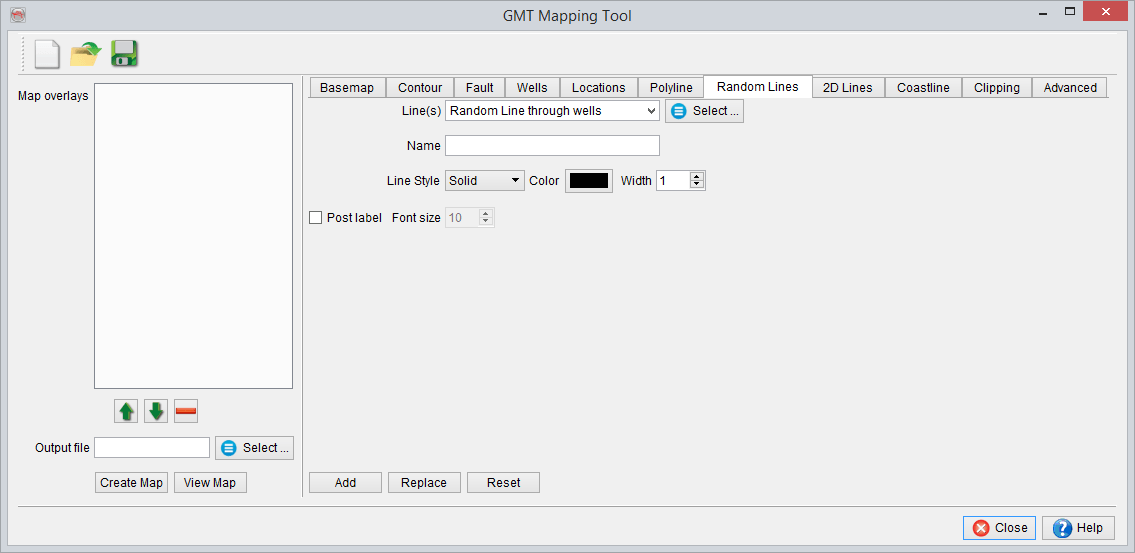
- Random Lines: It is used to post Random Line(s) in the map.
- 2D Lines: It is used to post 2D-Line(s) in the map.
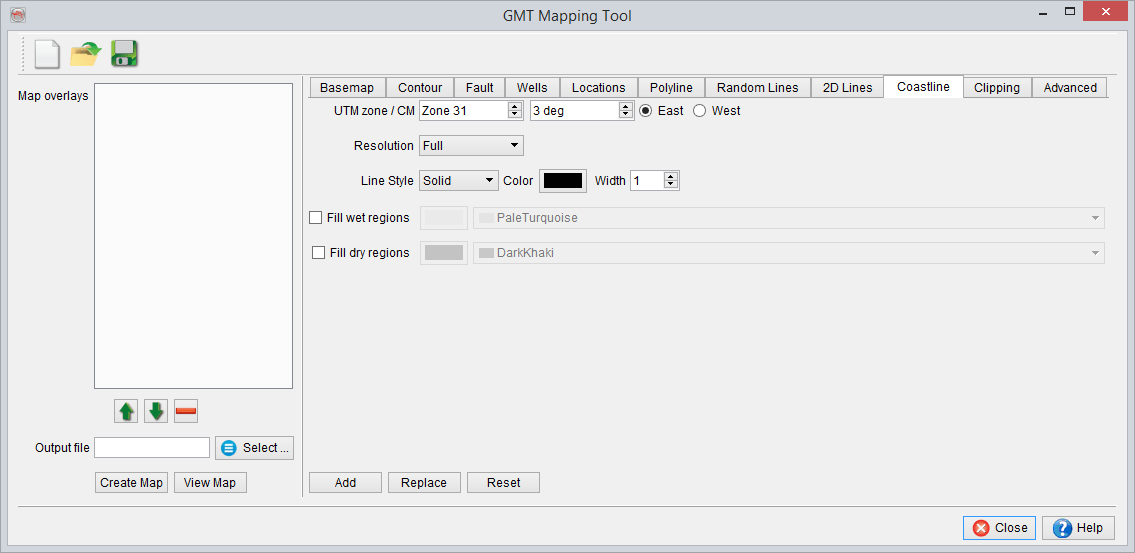
- Coastline: It is generally used to draw coastal lines.
- Clipping: It is used to set up polygonal clip paths.
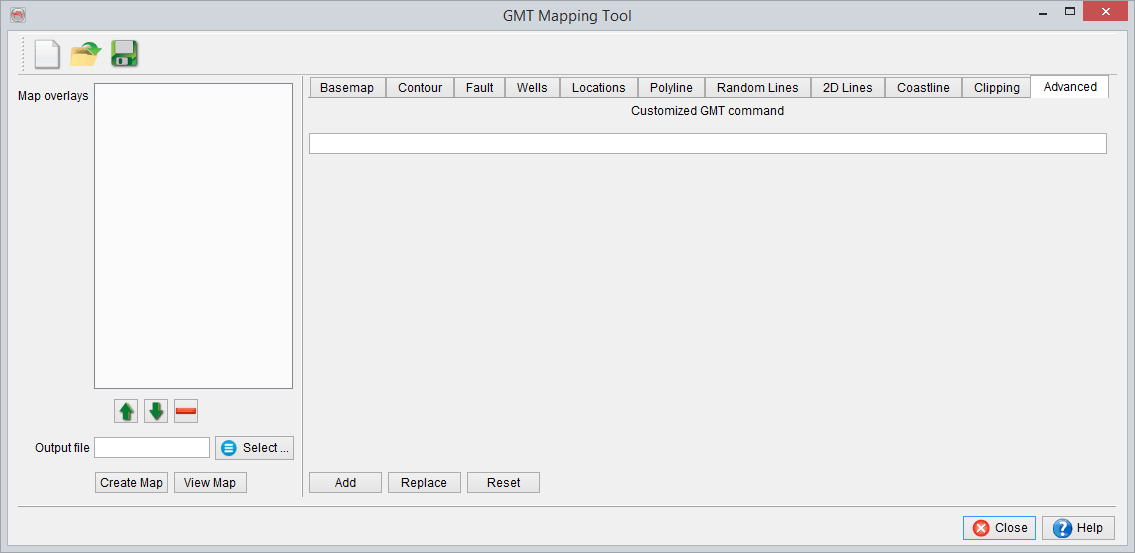
- Advanced: It is used to use customized GMT commands.
For all the sections it is possible to Reset the parameters and thus go back to the default ones. For all the section (except Basemap), Add will add the defined object to the map overlays and Replace will update it if the object has been previously defined.
In the Map overlays are listed all the elements that have been defined to be displayed on the final Basemap. You can modify the![]() order in using the icons or remove an object using the
order in using the icons or remove an object using the![]() icon. The map will be created only when clicking on Create Map.
icon. The map will be created only when clicking on Create Map.
Basemap settings
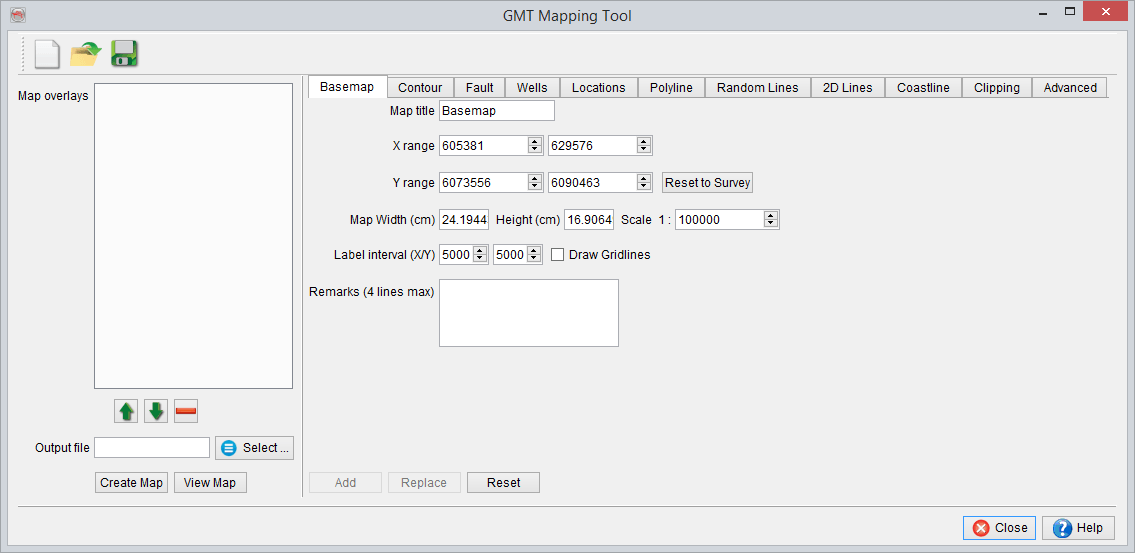
The basemap tab is filled with default parameters including the X/Y range from the Survey setup. You can go back at any point to the default X/Y range in clicking on Reset to Survey.
The map can be renamed. The scale can be modified. Scale, map width and height are linked : any change of the scale, map width or height will affect the other two parameters.
The label interval can be also be modified. The grid lines can be shown if you toggle on Draw Gridlines.Optionally you can also add Remarks.
Once the different parameters defined, give an appropriate name to the output file and specify the disk location and press Create Map button. View Map will display the map.
Create a Contour Map
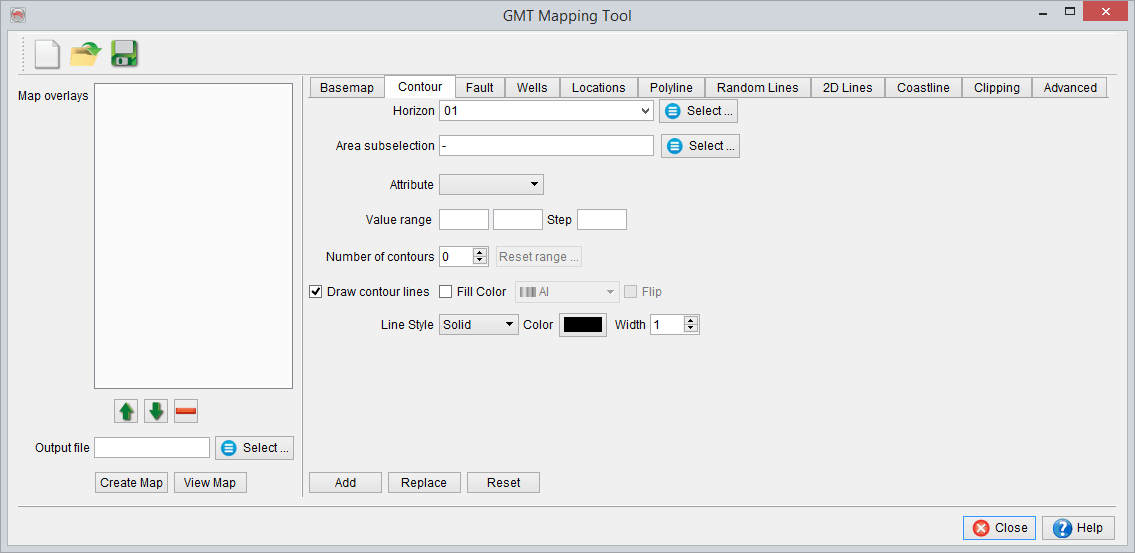
In Contour Map tab, first of all, select the horizon on which you want to create contours. The different parameters are then filled by default. It is possible to edit the value range and/or the number of contours. This will change the step. If you modify the step, it will automatically change the number of contours.
It is possible to change the display parameters. The contours can appear as simple contour lines or the space between the contours can be filled using a selected colourbar.
Once the parameters all defined, press Add button: the selected 2D data set(s) will appear on left Map overlays panel.
'Attribute' allows the user to select either Z-values (default option) or any of the Horizon Data saved to this horizon.
Insert faults
Insert Wells location
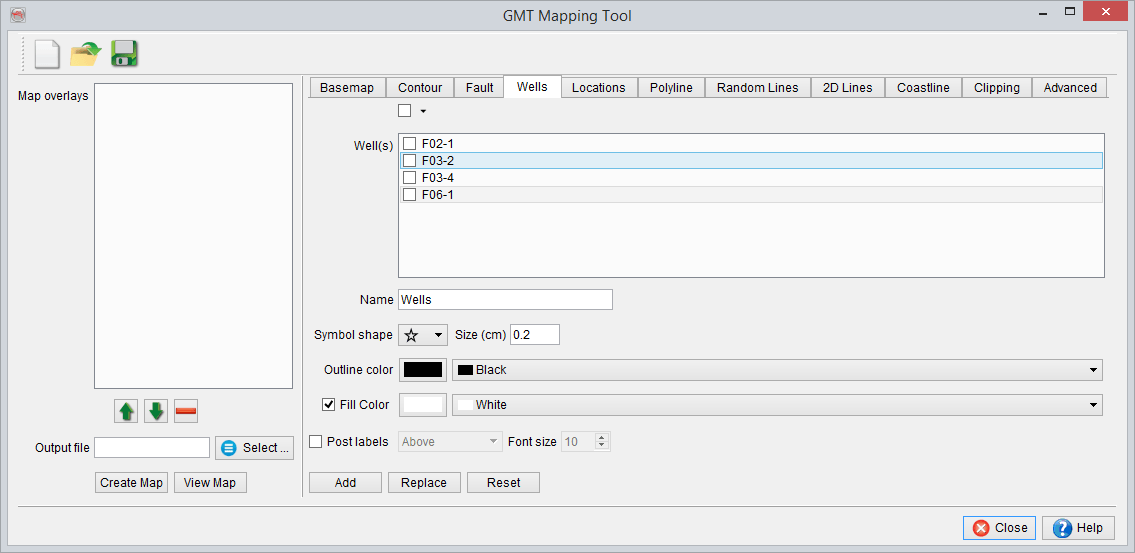
In Wells tab, specify:
- Select OpendTect Wells
- Optionally, edit the settings (symbols, size, color etc)
- Press Add button... the selected Wells will appear on left Map overlays panel.
Insert locations
Create a Polyline
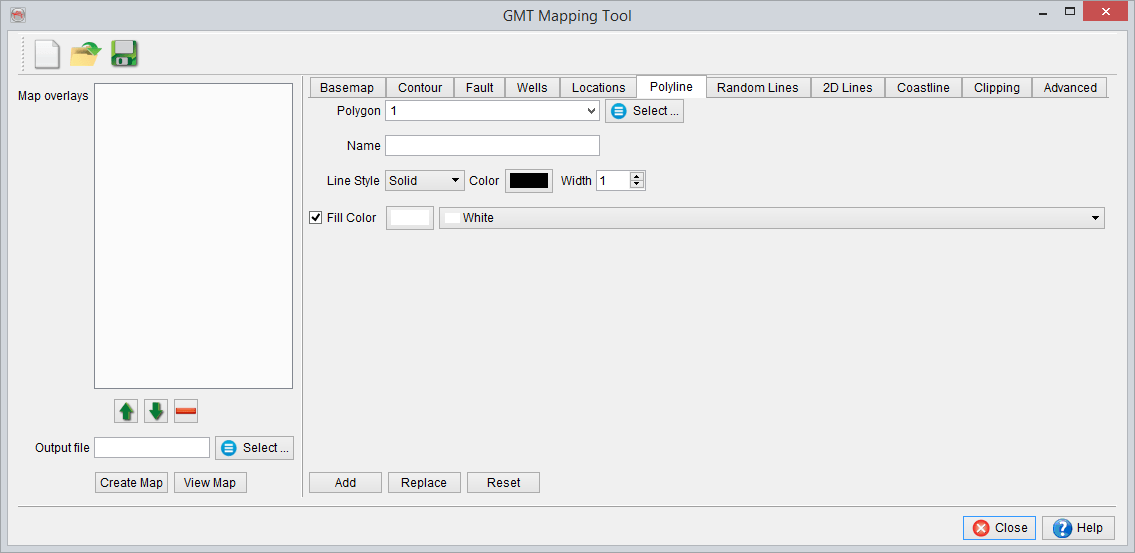
In Polyline tab, specify:
- Select Polygon
- Give a Name to the Polyline
- Optionally, edit the settings (symbols, size, color etc)
- Press Add button... the selected Polygon will appear on left Map overlays panel.
Insert random lines
Insert 2D lines
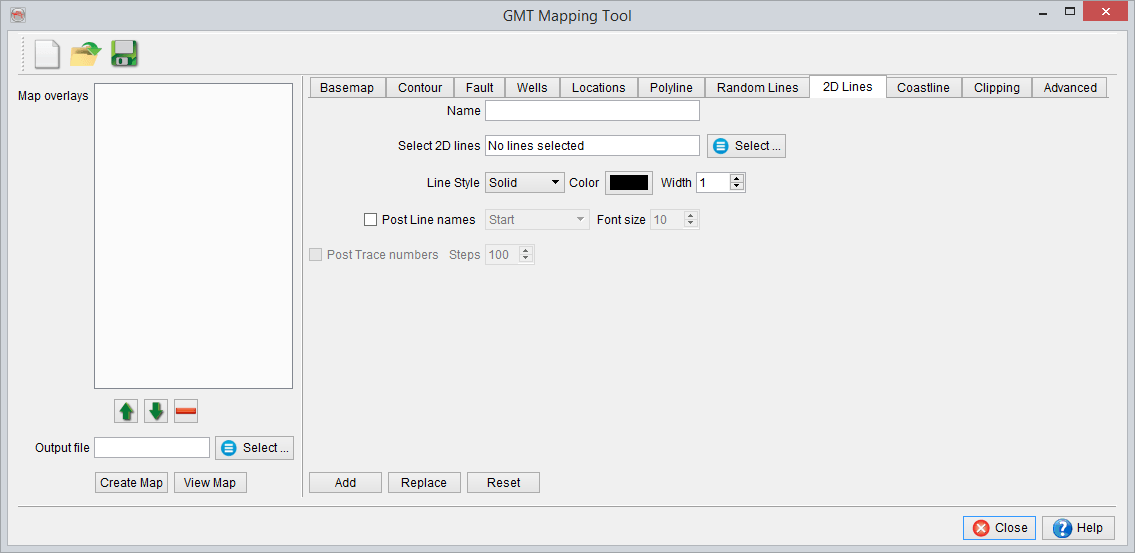
In 2D Lines tab, specify:
- Select 2D line(s)
- Name the line(s) (group).
- Edit the settings (symbols, size, color etc)
- Press Add button... the selected 2D line(s) group name will appear on left Map overlays panel.
Insert coastline
Clipping
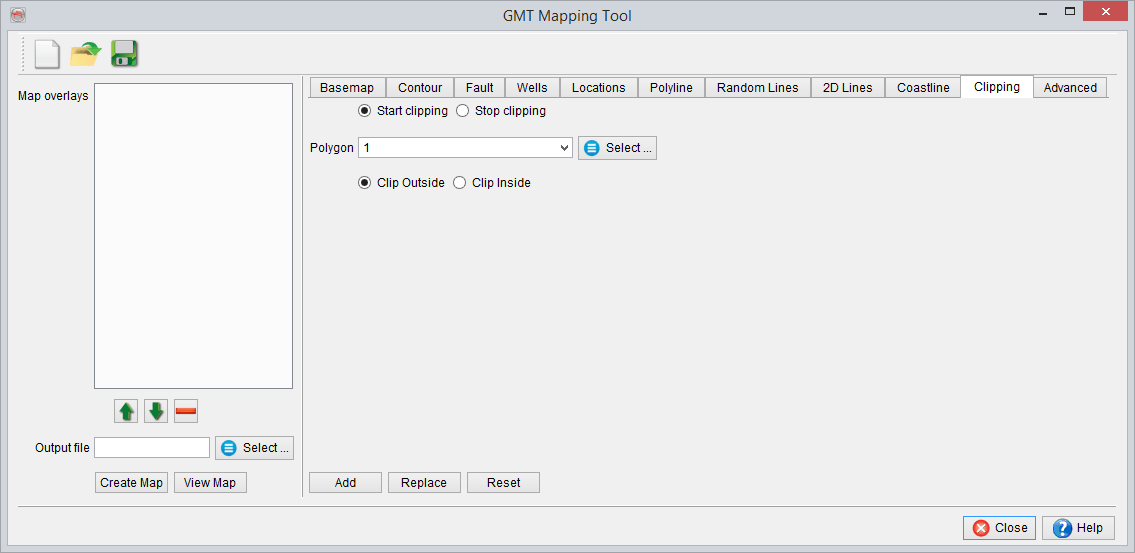
The final map will be restricted to the inside or outside of a given polygon.
Insert advanced commands
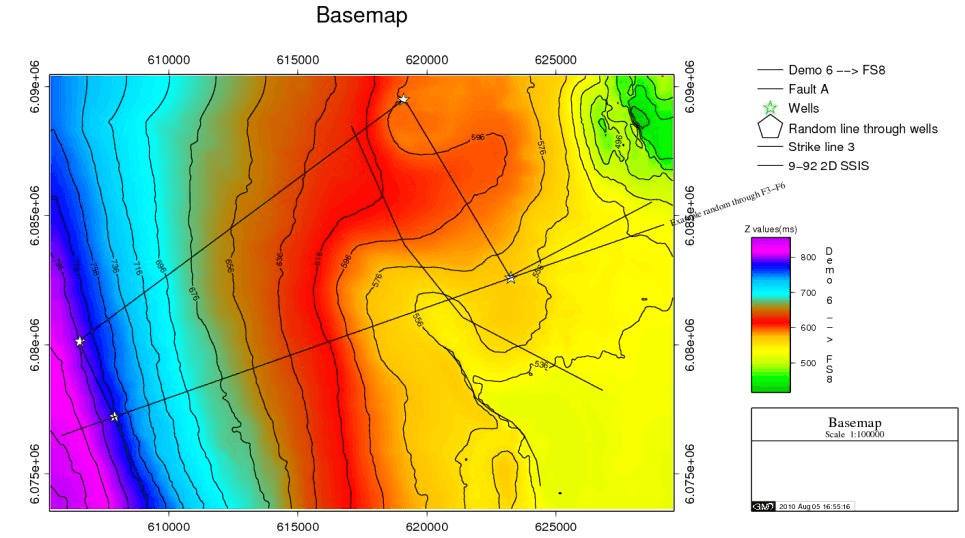
Typical output: