4.5.18 Well Data Management
The new Well Data Management table can be accessed from the small drop-down menu on the ‘Manage Wells’ icon ![]() in the Manage Toolbar (right edge of scene).
in the Manage Toolbar (right edge of scene).
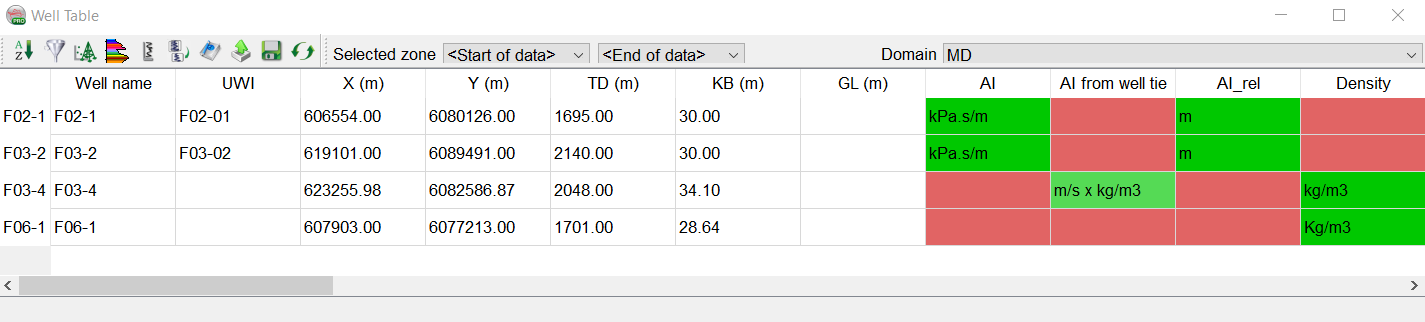
This opens a spreadsheet containing all the wells imported into the project, along with their info (UWI, X, Y, TD, KB and GL), all the logs and all markers present in these wells.
The wells are along the rows with their details, logs and markers in their corresponding columns. The logs which are present in the particular well have the corresponding cell coloured green, in different shades, depending upon the availability of logs in the selected zone(s) (decided by markers) and those unavailable are highlighted in red. Similarly, available markers have their corresponding cell coloured with the marker colour along with their depth.
The colour coding for availability of logs follow a four-tier system and goes from deep green to light green. The four tiers are: >75%, (75 - 50)%, (50 – 25)%, and <25%
On the top of the Well Data Management table, there is a toolbar which has a number of menus for data management. They are described below in the order they are in, going left to right:
![]() Enable sorting by activating column. Default sorts the wells alphabetically.
Enable sorting by activating column. Default sorts the wells alphabetically.
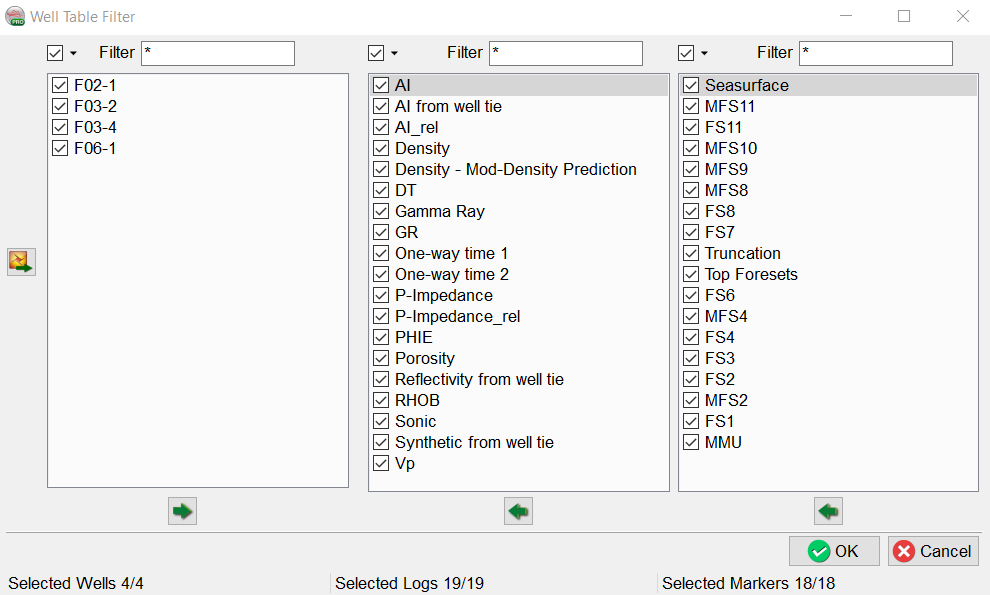
![]() Set Display Filters: set filter on which data (Wells, Logs and/or Markers) you wish to see displayed in the table (image below)
Set Display Filters: set filter on which data (Wells, Logs and/or Markers) you wish to see displayed in the table (image below)
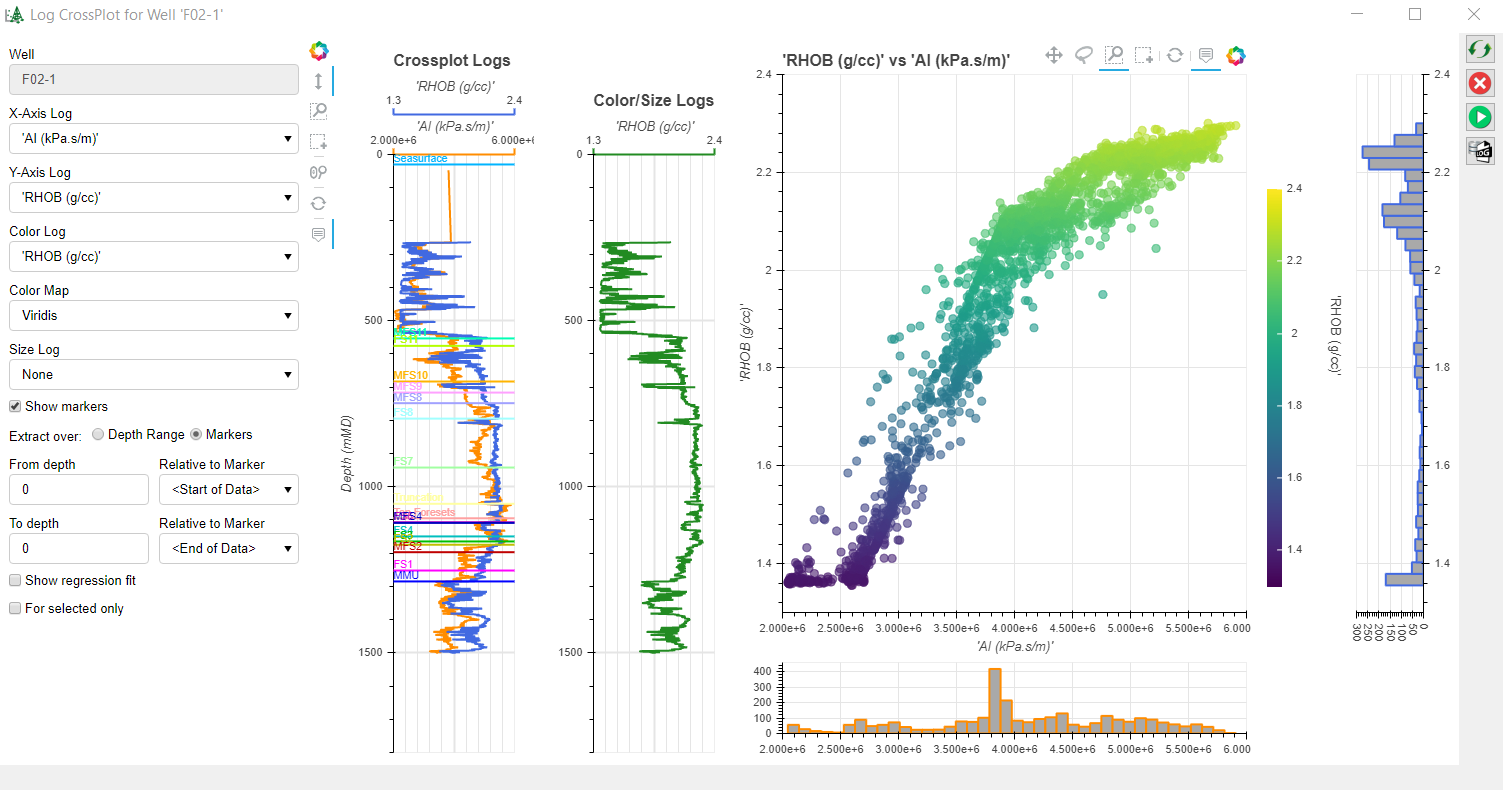
![]() Log CrossPlot (Bokeh): Cross-plot logs within specific depth range or with the markers’ depth.
Log CrossPlot (Bokeh): Cross-plot logs within specific depth range or with the markers’ depth.
![]() LogPlot (Bokeh): Plot logs and markers for a selected well within specific depth range. Modify display setting e.g. plot width, lines width, colors, etc.
LogPlot (Bokeh): Plot logs and markers for a selected well within specific depth range. Modify display setting e.g. plot width, lines width, colors, etc.
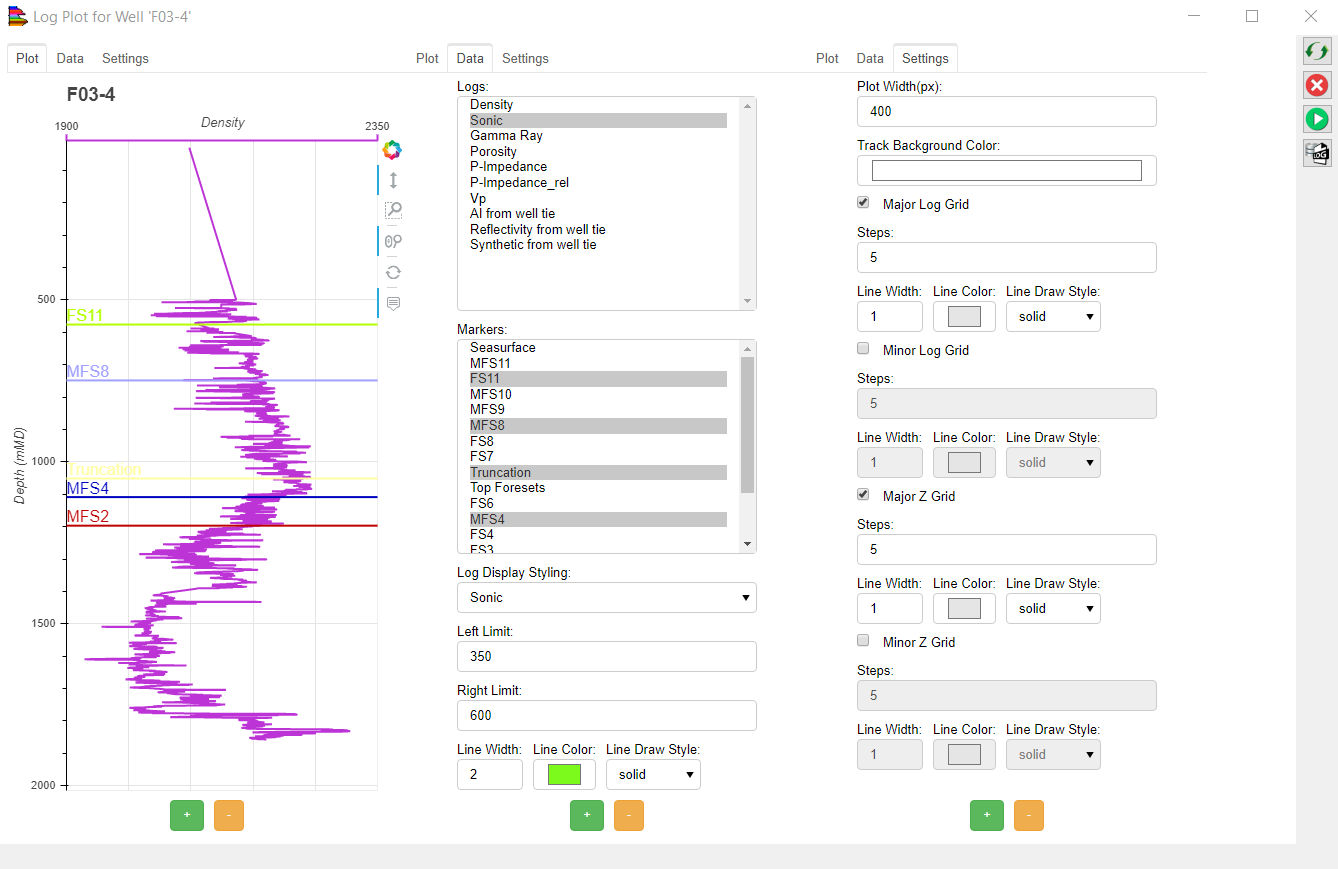
On the right of the LogPlot Window, there are a number of menus:
Reload and refresh the data in the tab
Terminate bokeh server
Restart bokeh server
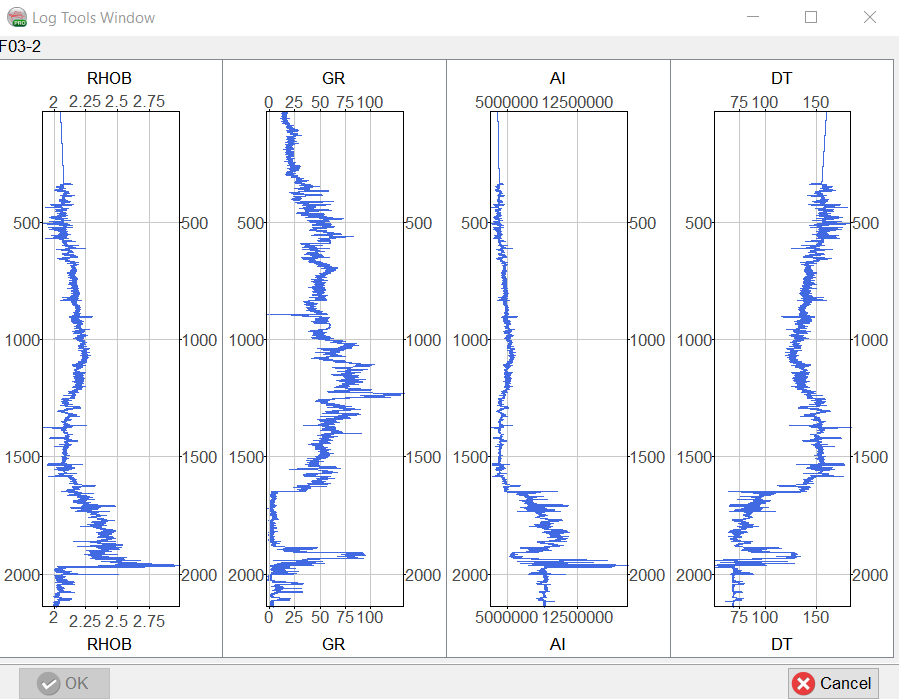
![]() View Selected logs: The selected logs in the table can be viewed using this menu in the Log Plot Viewer:
View Selected logs: The selected logs in the table can be viewed using this menu in the Log Plot Viewer:
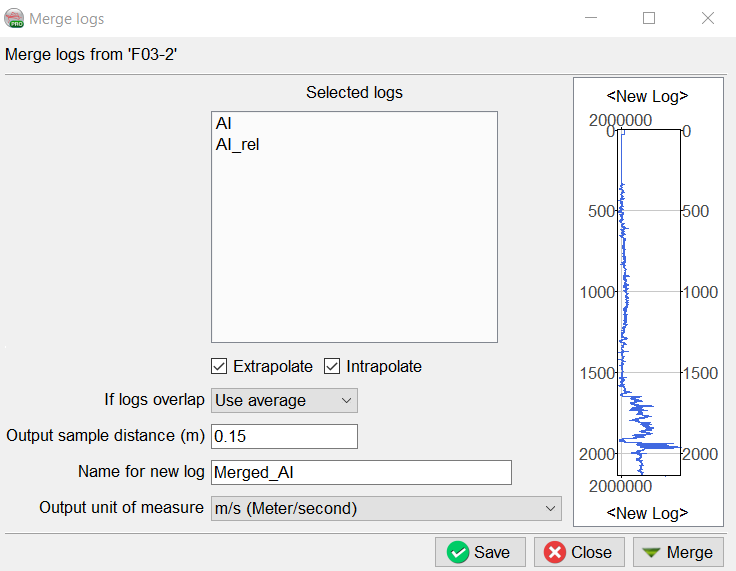
![]() Merge Well Logs from the same well: This icon will merge the selected logs for a particular well into one which can then be added to the database using the Save icon.
Merge Well Logs from the same well: This icon will merge the selected logs for a particular well into one which can then be added to the database using the Save icon.
Options are available to: extrapolate and/or interpolate when there are gaps, use average or one of the logs in the overlap area:
![]() Enable editing well information (Well name, UWI, X, Y, TD, KB, GL): Wells can be renamed, locked, removed or set as default. If the option is toggled off, then the info cannot be edited.
Enable editing well information (Well name, UWI, X, Y, TD, KB, GL): Wells can be renamed, locked, removed or set as default. If the option is toggled off, then the info cannot be edited.
![]() Exports Well information in ASCII format.
Exports Well information in ASCII format.
![]() Save: This writes all the changes made in the well table into the disc.
Save: This writes all the changes made in the well table into the disc.
![]() Reset Well Table: This button resets the table to its initial format.
Reset Well Table: This button resets the table to its initial format.
![]() This field allows the selection of a zone of interest (between two markers). Once a zone is set, the availability of logs displayed in the table might change depending on the zone.
This field allows the selection of a zone of interest (between two markers). Once a zone is set, the availability of logs displayed in the table might change depending on the zone.
![]() This field allows the selection of a depth domain to work with. The three options currently supported are MD (Measured Depth), TVD (True Vertical Depth), TVDSS (Truth Vertical Depth Sub-Sea).
This field allows the selection of a depth domain to work with. The three options currently supported are MD (Measured Depth), TVD (True Vertical Depth), TVDSS (Truth Vertical Depth Sub-Sea).