8.3.2.1 Random Distribution
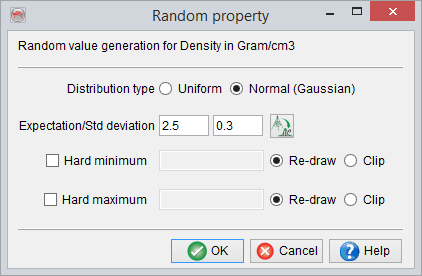
The modeled parameter value can be drawn from a uniform or normal (gaussian) distribution. This later is the most realistic for most logs, and formation thicknesses. It can nevertheless happen that the thickness distribution is uniform throughout the survey. A good way to estimate what distribution could be used is plot the histogram of the available data: Well logs for the logs, isopach maps for the thicknesses when the top and base have been interpreted. Displaying the histogram of the available data is more important than one could expect: If the log is spiky, the distribution will be skewed and the extracted average will be shifted from the real position.
It is possible to constraint the drawn value with hard extrema. There are two modes to do this:
- Either the value is re-drawn until it falls within the boundaries. You would typically do this for a sonic or density log.
- Or the value is clipped to the extrema. This is typical of a porosity log at its minimum (0%) or a water saturation log at its maximum (100%), since you can expect many of the layers to have exactly the extrema value.