5.3.2 Cross-Plot Table
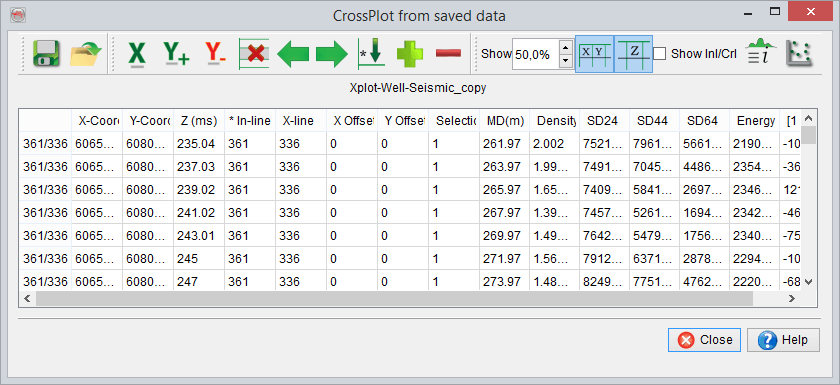
The crossplot table displays the extracted data. It is used to edit and plot the data for a crossplot. A row in the table corresponds to one extracted data point, annotated by its position (X, Y and Z) and followed by the collected attributes values (forming at vector, from left to right: logs, attributes, stored data). The star adjacent to an attribute name indicates sorted column. Empty cells represent attributes than could not be extracted with the provided the settings for data extraction.
The table enables the manipulation and edition of the collected data, prior to making cross-plots. For instance, it is possible to sort the data from an attribute, and to delete the first or last rows, before plotting the data. Please note that the table window is interactively linked with the cross-plot window. Any editing done in the cross-plot window will reflect in the table window that remains open and active while working in the cross-plot window.
Standard workflow: Save ![]() , edit, click in a column and then
, edit, click in a column and then ![]() , click in another column and then
, click in another column and then ![]() , launch the cross-plot window
, launch the cross-plot window ![]() .
.
You can select a column by either clicking on its title cell or by clicking on any single cell.
The toolbar contains the following editing tools:
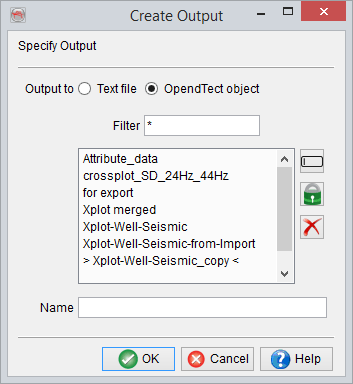
![]() Saves the data shown in the table to a file (simple text file or OpendTect object). OpendTect object is a special format to retrieve (open) the cross-plot. The format is called position vector data and the data is saved in the survey sub-directory (/Features/*.pvds). The Text file selection outputs the data to an ASCII (column sorted) file that later on can be used in 3rd party software e.g. Excel.
Saves the data shown in the table to a file (simple text file or OpendTect object). OpendTect object is a special format to retrieve (open) the cross-plot. The format is called position vector data and the data is saved in the survey sub-directory (/Features/*.pvds). The Text file selection outputs the data to an ASCII (column sorted) file that later on can be used in 3rd party software e.g. Excel.
![]() Open/Retrieve the stored crossplot data. An alternative short-cut is present in the menu Analysis > Cross-plot > Open Crossplot.
Open/Retrieve the stored crossplot data. An alternative short-cut is present in the menu Analysis > Cross-plot > Open Crossplot.
![]() Assigns the X-axis of the cross-plot to a selected/highlighted column.
Assigns the X-axis of the cross-plot to a selected/highlighted column.
![]() Assigns the Y-axis of the cross-plot to selected/highlighted column.
Assigns the Y-axis of the cross-plot to selected/highlighted column.
![]() Removes the selected Y-axis for cross-plotting.
Removes the selected Y-axis for cross-plotting.
![]() Removes the selected rows in the table.
Removes the selected rows in the table.
![]() Moves the selection of the primary Y-axis one column to the left. The cross-plot gets updated accordingly.
Moves the selection of the primary Y-axis one column to the left. The cross-plot gets updated accordingly.
![]() Moves the selection of the primary Y-axis one column to the right. The cross-plot gets updated accordingly.
Moves the selection of the primary Y-axis one column to the right. The cross-plot gets updated accordingly.
![]() Sorts the selected column to an increasing order, from top to bottom.
Sorts the selected column to an increasing order, from top to bottom.
![]() Add an empty column in the table. In the pop-up window, the column name is provided. The mathematical operation is done to compute the data for the new column. An example is the Acoustic impedance data computed from the velocity and density logs available in the crossplot table. For further information on the mathematical operators, please find the description on the Mathematics attribute in the Appendix.
Add an empty column in the table. In the pop-up window, the column name is provided. The mathematical operation is done to compute the data for the new column. An example is the Acoustic impedance data computed from the velocity and density logs available in the crossplot table. For further information on the mathematical operators, please find the description on the Mathematics attribute in the Appendix.
![]() Removes the selected column from the crossplot.
Removes the selected column from the crossplot.
 Displays selected percentage of the data. If a lot a data was extracted not all will be displayed in the table. Nevertheless the sort and remove lines tools may still apply to all the extracted data, upon request of the user.
![]() Toggles on/off the display of the coordinates.
Toggles on/off the display of the coordinates.
![]() Toggles on/off the display of Z values.
Toggles on/off the display of Z values.
![]() Shows histogram and statistics on the selected column.
Shows histogram and statistics on the selected column.
![]() Allows to achieve vertical variogram analysis. A variogram describes the spatial continuity. The vertical variogram can be computed for any of the attribute or log from the extracted data. To achieve a variogram analysis from well log, the log data is resampled at the variogram processing step and de-trended prior to the variogram computation itself. In the pop-up windows, the different parameters can be defined: the maximum range (maximum distance allowed between the pairs for the analysis), the step and the minimum pairs per log distance. Once these parameters provided, the variogram is computed and the analysis can be performed.
Allows to achieve vertical variogram analysis. A variogram describes the spatial continuity. The vertical variogram can be computed for any of the attribute or log from the extracted data. To achieve a variogram analysis from well log, the log data is resampled at the variogram processing step and de-trended prior to the variogram computation itself. In the pop-up windows, the different parameters can be defined: the maximum range (maximum distance allowed between the pairs for the analysis), the step and the minimum pairs per log distance. Once these parameters provided, the variogram is computed and the analysis can be performed.
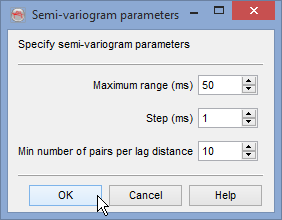
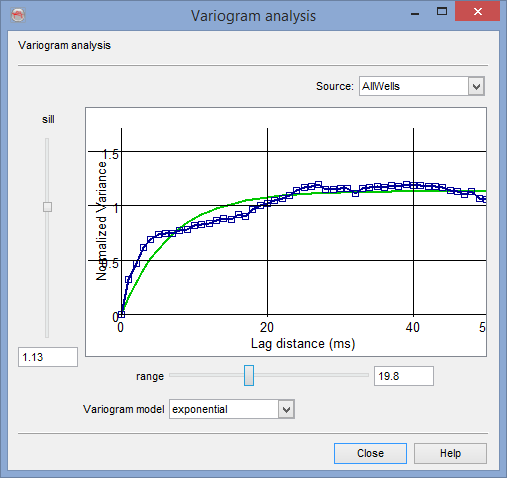
Variogram analysis: Set parameters (left), main window(right) : blue = real data, green = model
A synthetic variogram can be set in changing the sill, the range and also the variogram model (exponential, spherical, gaussian). The objective is to get a synthetic variogram that best describes the real variogram. The data can be analyzed for each well or for all of them. The analysis results can be used when achieving inversion.
![]() Launches the crossplot window.
Launches the crossplot window.