5.4.2.3 Well-Tie Display Panel
The display panel is the main window where the wells are tied to the seismic data. This module is primarly used to update the current (loaded) time-depth curve. Previous, intermediate and final TD curves can be exported to ascii at any moment using the following icon ![]() .
.
A secondary output of the synthetic-to-seismic tie is the estimated wavelet, that is estimated at any time and must be saved explicitly.
The view is separated in three frames, from left to right:
- The sonic (red) and density (blue) logs.
- The computed impedance (red) and reflectivity (blue) logs.
- The computed/extracted synthetic and composite seismic traces.
The raw logs are shown before upscaling. The vertical axis of all 3 frames is in travel time.
Key points:
- The time-depth conversion and synthetic seismic traces computation is done using the current time-depth curve and checkshot (if available).
- The checkshot data acts as a strong constraint, i.e. any input and output time-depth curve will be forced to honour the checkshot.
- The time of the depth TVDSD=0 will always remain at TWT=0 even when applying a bulk shift: The difference is absorbed between the point TVDSS=0 and the first sonic log sample. The reference datum elevations definitions are summarized in the well track import chapter.
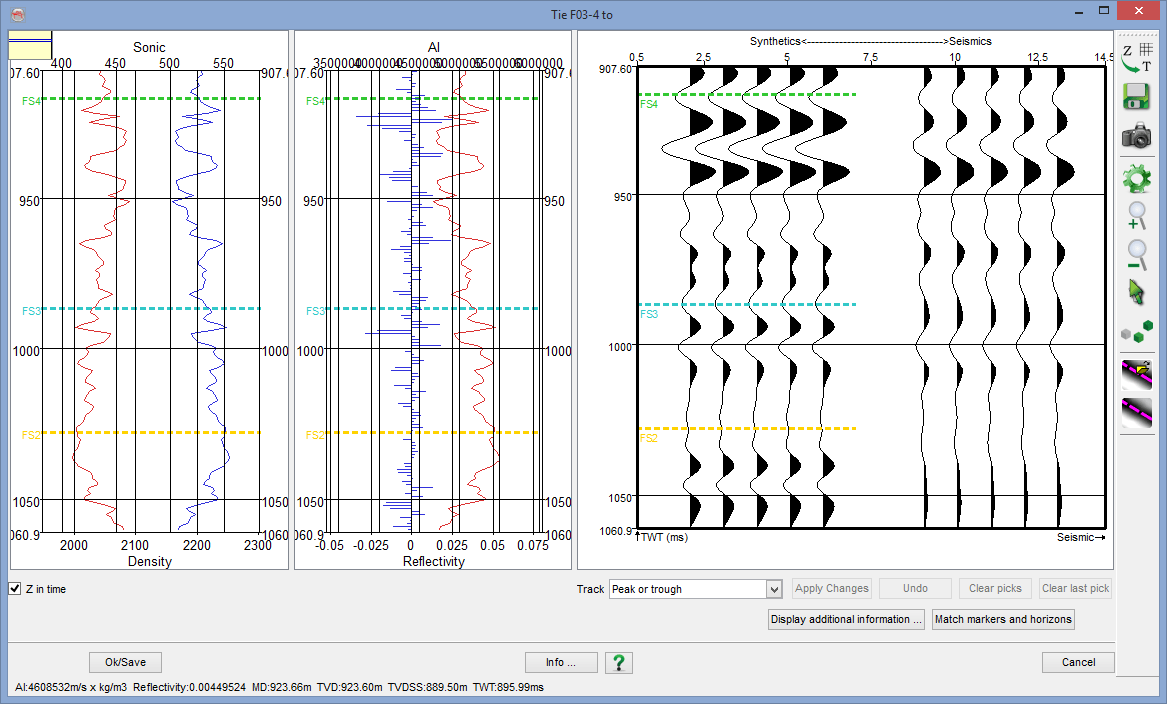
Display panel for the well-seismic tie.
At the bottom right corner of this display panel, there are several tracking controls. The options are used to pick an event to match the seismic and synthetic traces. After picking the event, press Apply Changes to reflect the changes and update the time to depth model.
![]() Launches the Edit Time/Depth model window. In the pop-up window, press Export button to export the time-depth model as an ASCII file.
Launches the Edit Time/Depth model window. In the pop-up window, press Export button to export the time-depth model as an ASCII file.
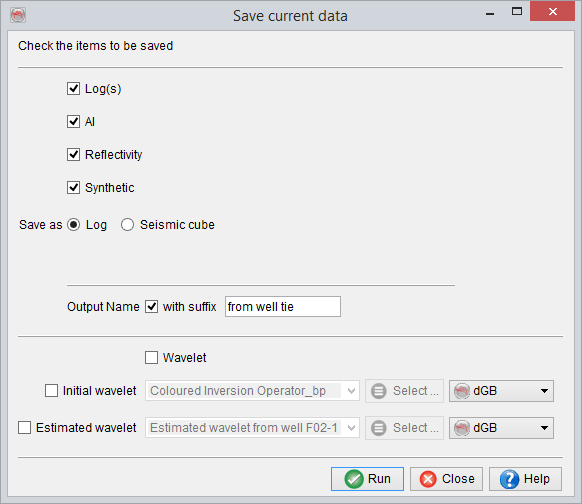
![]() Launches the save option.
Launches the save option.
You can either save the created logs:
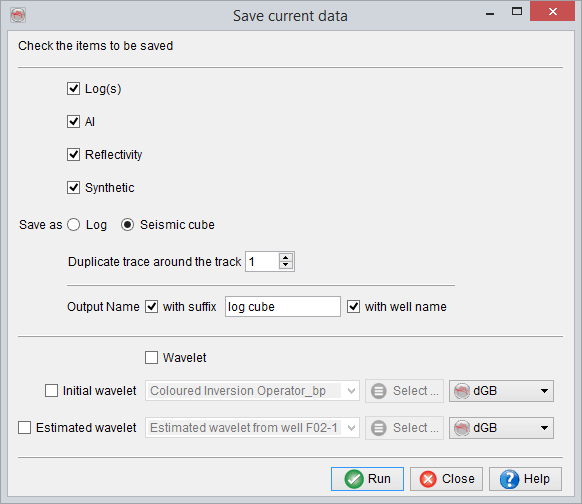
Or save the synthetic trace as a seismic volume.
![]() Takes the snapshot of the display panel
Takes the snapshot of the display panel
![]() Display settings/properties for the panel. The settings are similar to that of the normal 2D-viewer model
Display settings/properties for the panel. The settings are similar to that of the normal 2D-viewer model
![]() Zoom-in
Zoom-in
![]() Zoom-out
Zoom-out
![]() Toggles interact mode ON/OFF
Toggles interact mode ON/OFF
![]() Pick seeds on the seismic or synthetic to update the time to depth model.
Pick seeds on the seismic or synthetic to update the time to depth model.
Change in depth/time model
- Choose a tracking mode (e.g. maxima, minima, zero-crossings etc.) and select events in the synthetics/seismic displays by first selecting the Pick mode button. Events can not be picked separately. Each event in the synthetics must be linked with an other event in the seismic.
- Once all the events are selected on both synthetics/seismic displays, press Apply changes button. The depth/time model and the whole computational workflow will be recomputed. If needed, repeat the operation.
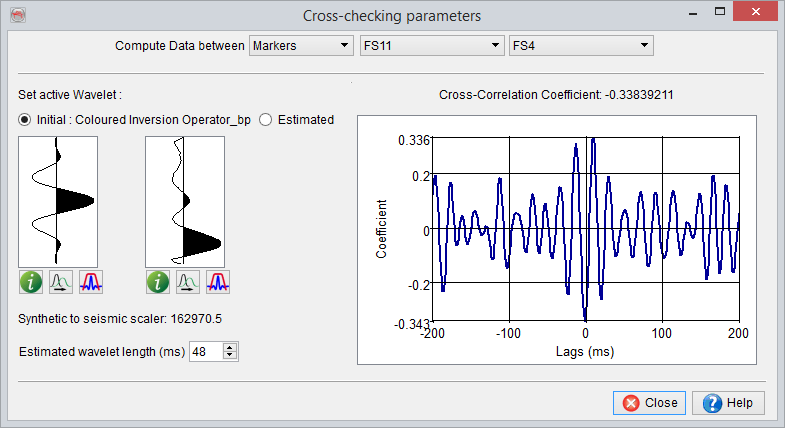
- The Display additional information button will open the Cross-checking parameters window, and provide useful cross-checking tools, such as correlation coefficient and estimated wavelet in a specific depth range. The estimated wavelet displayed here can also be saved:
- The depth/time table can be saved between each state by pushing the Save button, in the toolbar to the right of the synthetics/seismic displays, and saving with an appropriate name. The View/Edit Model button allows the user to import a depth/time table.
- Once a good correlation has been established, click on Ok/Save and save the depth/time model.