2.6 2D Viewer
The 2D Viewer is a flat viewer for visualizing and interpreting 2D and 3D seismic data. When zoomed in use middle-mouse click and drag to pan through the entire section. 2D viewers can be launched in different ways:
- From the main OpendTect window using the View menu, option 2D Viewer.
- From the variable density
 and wiggle
  display icons that appear when the display element is selected in the 3D window.
 - From the Basemap utility (only if you have access to OpendTect Pro)

Tree. Each 2D viewer features a tree to populate and manipulate the graphics window. Use right-click on the object to open the corresponding menu. The 2D Viewer supports two modes of visualization: variable density and wiggles + variable area. Per default the same attribute is used in both modes but the user is free to select different attributes per mode (Select attribute menu).
2D Graphics area. For 2D seismic lines you can open a crossing 2D line using right-click on the annotated cross-line. When the 2D viewer displays an inline you can open a crossline or a time-slice at any position using right-click. It is also possible to change the display properties by right-clicking in the graphics area. Alternatively use the ![]() icon. For details, see Display Parameters below.
icon. For details, see Display Parameters below.
Position and Color toolbars. To interpret every Nth line set the step to N and use the arrows (or
Display toolbar.

![]() Rubberband zoom.
Rubberband zoom.
![]() Zoom in with a fixed step (same zoom for horizontal and vertical).
Zoom in with a fixed step (same zoom for horizontal and vertical).
![]() Zoom out with a fixed step (same zoom for horizontal and vertical).
Zoom out with a fixed step (same zoom for horizontal and vertical).
![]() Zoom in vertically with a fixed step (horizontal zoom does not change).
Zoom in vertically with a fixed step (horizontal zoom does not change).
![]() Zoom out vertically with a fixed step (horizontal zoom does not change).
Zoom out vertically with a fixed step (horizontal zoom does not change).
![]() Cancel zoom (displays the entire element).
Cancel zoom (displays the entire element).
![]() Maximize the display to fit the screen.
Maximize the display to fit the screen.
![]() Sets the home zoom level. There are three different home zoom levels:
Sets the home zoom level. There are three different home zoom levels:
- Set the zoom level for current window only.
- Set the zoom level for all 2D viewers that will be launched thereafter.
- Set horizontal and vertical levels manually.
![]() Return to the home zoom level.
Return to the home zoom level.
![]() Flip left and right.
Flip left and right.
![]() Grab the image and save as a picture.
Grab the image and save as a picture.
![]() Print the image.
Print the image.
![]() Display the scalebar.
Display the scalebar.
![]() Set display parameters (see below)
Set display parameters (see below)
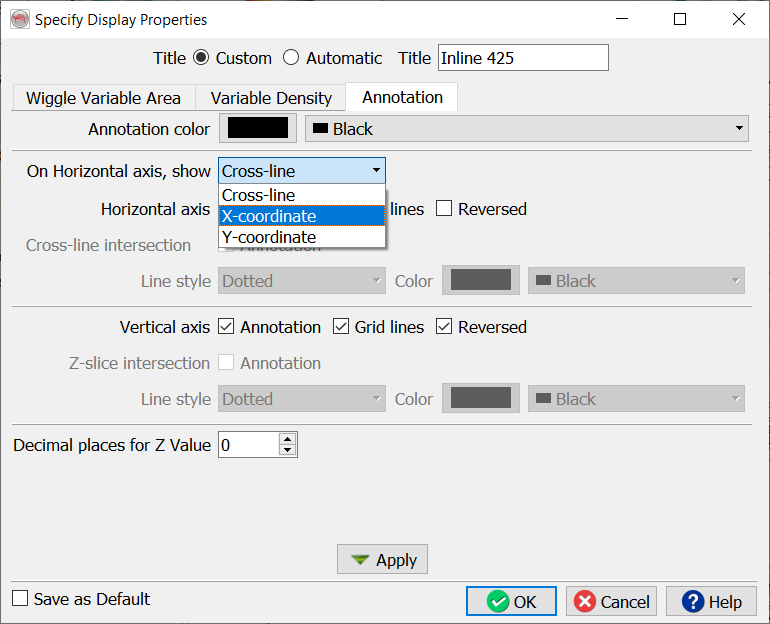
Display Parameters. can be modified in the Specify Display Properties window, which features three tabs:
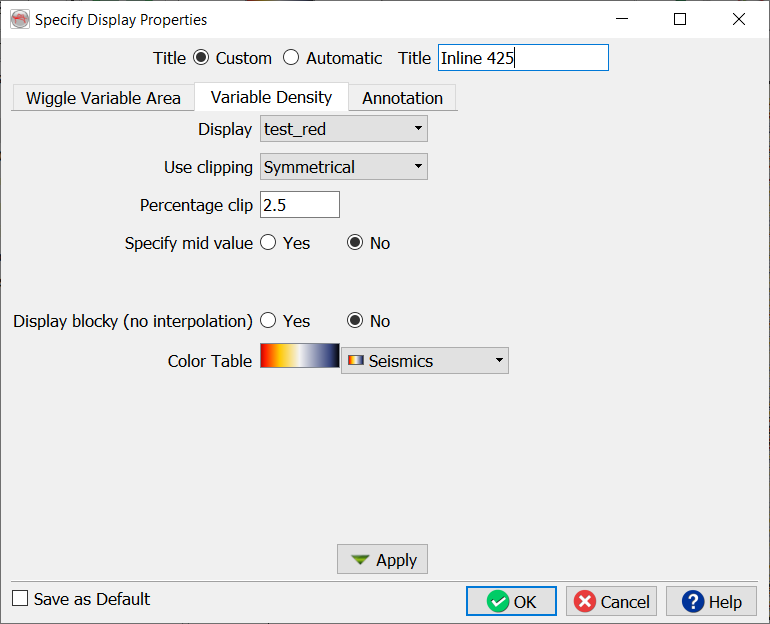
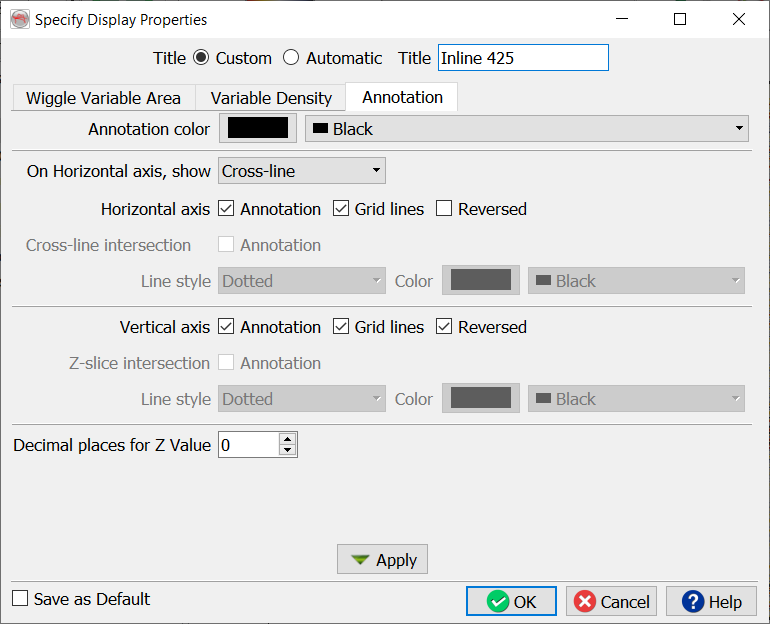
Please note that under the 'Annotation' tab, the user may choose between different distance values to be displayed on the Axis-distances:
- Trace number (only for 2D): This will display the traces number on the X axis
- Reference position*: This displays the SP (shot points) number that is available in the shot point header field of the original SEG-Y
- X-Coordinate: This shows the X coordinate in the axis
- Y-Coordinate: This displays the Y coordinate in the axis
![]() Interpretation mode toggle. If the toggle is on you can add seed positions to the horizon you are tracking. In this mode the cursor is a cross. When you toggle this mode off you are back in Position mode. The cursor is an arrow.
Interpretation mode toggle. If the toggle is on you can add seed positions to the horizon you are tracking. In this mode the cursor is a cross. When you toggle this mode off you are back in Position mode. The cursor is an arrow.
![]() Pops up the horizon tracking setup window.
Pops up the horizon tracking setup window.
![]() Polygon selection tool. Use this to select areas that need to be removed. Alternatively, when you are in manual draw mode, use Control - Left Click + Drag to remove parts of a horizon.
Polygon selection tool. Use this to select areas that need to be removed. Alternatively, when you are in manual draw mode, use Control - Left Click + Drag to remove parts of a horizon.
![]() Delete the selected area.
Delete the selected area.