3.2 Inline, Crossline & Z-Slice
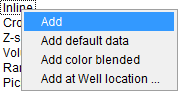
Inline, Crossline and Z-slice elements can be added into the tree by clicking on the element name and selecting Add/Add default data/Add color blended from the pop-up menu. The Add option will insert an inline/crossline/Z-slice with a blank line in the middle of the survey (ready for an attribute or stored cube to be loaded). If a well has been loaded in the project and is within the survey box, it is possible to Add at Well location an inline or crossline. The inline/crossline loaded will be according to the surface coordinates that can be found in the well manager information summary section. Once added, a selection window will pop up to select the attribute to display: Stored volume, Attribute from the active attribute set,... If cancel is clicked, the attribute line will stay blank in the scene and the tree entry will read <right click>.
Prestack stored cubes will appear in the list surrounded by curly brackets {}. They can be displayed on the slices of the 3D scene as common offset volumes, in a similar way to the components of
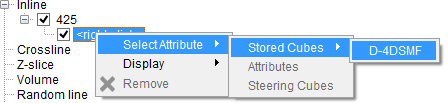
Any desired cube can be selected from the list. The selected cube will be added as an attribute for the displayed inlinecrossline/Z-slice number. The added attribute can also be replaced at any time by right-clicking on it (see the figure below).
The check-boxes are used to show/hide the corresponding sub-element of inline/crossline/Z-slice.
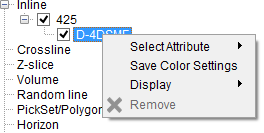
After an attribute is displayed in the scene, it can be manipulated further by right-clicking over it (see figure below). The explanation for this list is described at the end of this section.
Pop-up List Menus
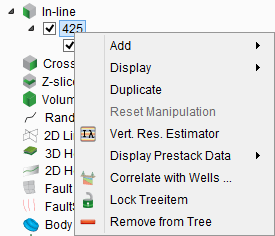
Each individual element (Inline/Crossline/Z-slice) has a similar pop-up list menu (see below). There are two different ways to open this list. Either display it from the Tree (as shown below) or display it in the scene. In the latter case, place the mouse over the inline/crossline/Z-slice and right-click to launch the tree. This menu list has several functions that are described in following text.
Add
- Attribute: Add an additional blank attribute for the corresponding inline/crossline/Z-slice number. The attribute data (stored cubes or the attribute definition) can be displayed by right-clicking on it and selecting the desired attribute. Up to eight different attributes can be displayed within one element (inline, crossline, Z-slice).
- Volume Processing attribute: This option will add the volume processing attribute.
- HorizonCube Display: This will display the HorizonCube. It requires the HorizonCube plugin.
- Systems Tracts Display: This adds system tracts interpretation. It requires the SSIS plugin.
Display
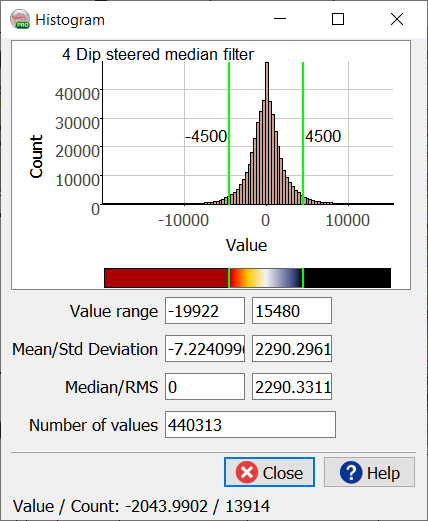
Histograms: The histograms of all added attributes of an element can be displayed using the right-click option of the parent element (inline number, surface name...). It is a useful tool to clip the ranges of an attribute by using vertical green lines in the histogram: The vertical green lines show the current amplitude range and can be moved left or right using the left mouse-click. The display is updated when the mouse click is released. This is performed independently for each attribute. Please note that this will toggle off the automatic clipping.
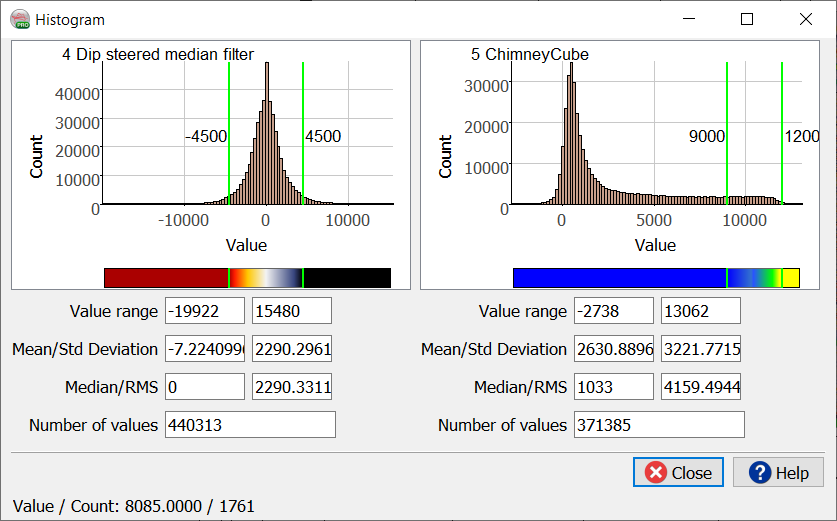
A multi-histogram display for an inline containing two attributes (DSMF Seismic and Energy).
The green lines do not appear on histograms displayed fro single attributes.
Positions: Change an inline/crossline/Z-slice number. This option is used to manipulate (sub-select a range of traces/time) a line or to quickly scroll through the data for visualization.
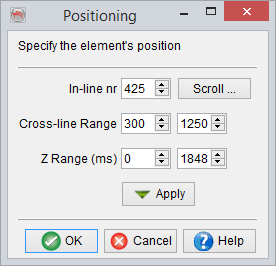
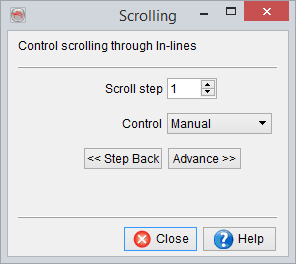
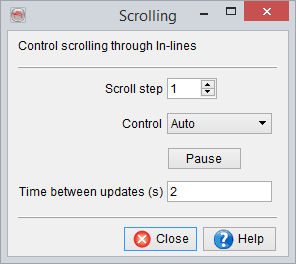
(L to R) Manipulate or scroll the inline; Manual Scroll and Auto Scroll
By pressing the Scroll button, elements are moved either manually (select Control Manual), or automatically (select Control Auto). Scroll in the inline/crossline direction by specifying a fixed Scroll step. In the manual mode, the line/Z-slice is stepped to the new position after each subsequent click on the Advance button. In the automatic mode, the line/Z-slice is updated in a movie-style with a fixed time interval (in seconds) - Time between updates. The auto-scrolling can be paused by pressing the Pause button. To resume the auto-scrolling again press Go button.
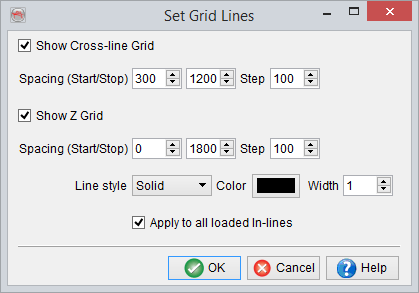
Gridlines: Enables displaying grid lines on the particular element. A new menu appears where the grid line spacing, style, color and width can be set.
Resolution: Edit the graphical resolution of the element. The Default does not involve any rescaling before the data is sent to the graphic card. The options Moderate and High do some pre-interpolation before the data is sent to the graphic card and generally results in a cleaner picture. If the memory of your graphic card does not allow high resolution, the element becomes black.
If Shading is on, the resolution option is not available anymore(except for the horizon element).
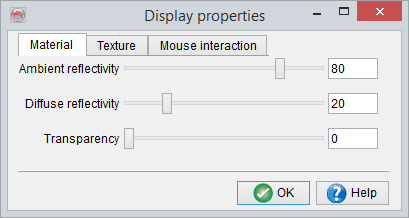
Properties: Access display parameters; Transparency, Ambience/diffuse relflection, texture and mouse movement (scroll and pan settings).
Duplicate: Add a new duplicate/copy of a selected element in the tree.
Reset Manipulation: Reset changes made in the position of the line/Z-slice. Restore the original configuration.
Display PS Gather: Pop-up a prestack viewer perpendicular to the inline or crossline.
Note: It is also possible to display the offset of each CDP gather similarly to any poststack data. The prestack data is available in the list of stored cubes and is marked with quotes { }, at the end of the list.
Correlate with wells: This will correlate the line with 2D well
Lock: Lock the selected object. Prevents accidental removing, moving or displaying data on the object. After clicking Unlock, all editing is again enabled.
Remove: This removes the element from the OpendTect tree and the graphics area.
The options available for attribute pop-up menu list are briefly described here:
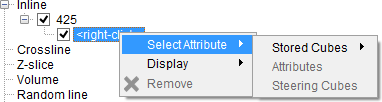
Select Attribute: When selected, data can be displayed from stored cubes or an attribute from the current attribute set (if available). To display an attribute, select or create an attribute set first.
Save Colour Settings: Save color settings for a specific stored volume and make them available for future use.
Move: Move the attribute up, down, to top of the list, or to bottom of the list.
Display
Show Histogram: Display data statistics (selected attribute) of the defined volume as a histogram in a pop up window.
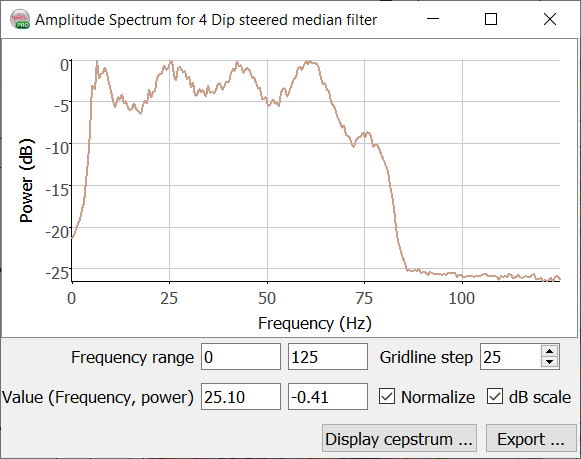
Show Amplitude Spectrum: Amplitude vs frequency plot will be shown in pop up window. Moving the mouse over the spectrum displays the Values.
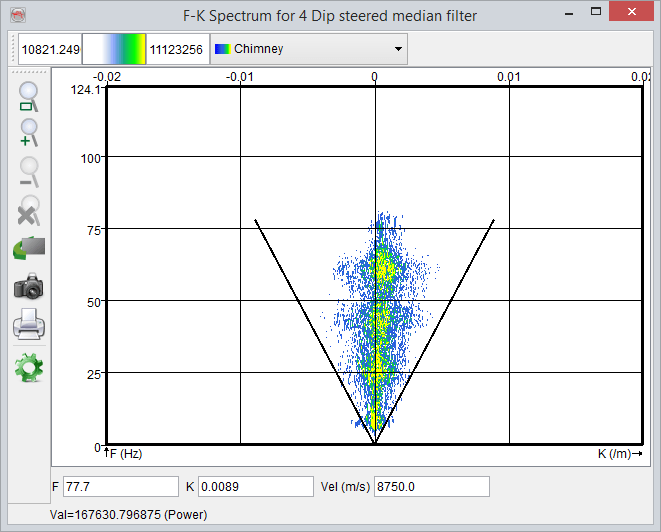
Show F-K Spectrum: A two-dimensional Fourier transform over time and space where F is the frequency (Fourier transform over time) and K refers to wave-number (Fourier transform over space).
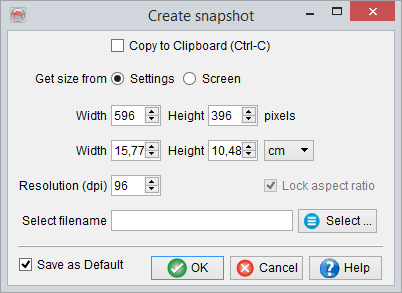
Pressing Ctrl+P in either the Histogram, Amplitude- or F-K Spectrum windows pops up a settings window where you may define parameters for a snapshot:
- Change transparency: Change the transparency of the attribute item to view one or more overlaying attributes simultaneously.
- 2D Viewer - VD / Wiggles: Display an attribute in the 2D viewer as "Wiggle" or "VD" (Variable Density). For more details, please refer to:
Remove: Removes the attribute item from the tree.